
A $20 RPM is not automatically better than a $15 RPM. What matters is the money left after the switch.
In the worked example below, the higher rate looks attractive. But if traffic falls 20%, extra fees and switching costs leave the publisher $600 worse off over six months. That does not mean switching is bad. It means the offer needs a break-even check.
Check your own switching costs in the free planning lab →
First, make sure both RPMs count the same thing
RPM means revenue per thousand units. The unit matters as much as the number.
Raptive’s RPM guide distinguishes session RPM from page RPM. Mediavine’s mRPM explanation uses sessions in which at least one ad was served. These rates should not be compared as though they had the same denominator.
Before entering an offer, write down:
- The traffic unit: pageviews, sessions or monetized sessions.
- The revenue basis: money payable to you, or gross advertising revenue before the network’s share.
- The complete date range and currency.
- Any extra fees, temporary guarantee and end date.
Our calculator uses page RPM after the network’s share. Do not subtract that share a second time. If your report only gives session RPM, use your own matching pageviews and earnings to calculate page RPM. Do not use an internet conversion factor.
The six-month comparison
These are chosen assumptions to explain the calculation, not earnings from a real publisher or prices quoted by a particular network.
| Starting figures | Value |
|---|---|
| Monthly pageviews before switching | 100,000 |
| Monthly revenue if you stay | $1,500 |
| Current page RPM | $15 |
| New network page RPM, after revenue share | $20 |
| Extra monthly fee | $100 |
| One-time switching cost | $600 |
| Comparison period | 6 months |
With no traffic change, the new network earns $2,000 per month before the extra fee. The monthly gain is $400. Over six months, that is $2,400, less the $600 one-time cost: $1,800 ahead.
Now keep the new network RPM at $20 and change only traffic:
| Sustained traffic loss | New network monthly revenue | Six-month gain versus staying |
|---|---|---|
| 0% | $2,000 | +$1,800 |
| 10% | $1,800 | +$600 |
| 15% | $1,700 | $0 |
| 20% | $1,600 | −$600 |
At 20% loss, revenue is still $100 higher each month than the $1,500 baseline. But the extra monthly fee uses up that difference. The one-time cost is never recovered within this scenario.
A lower traffic count is a stress-test assumption here. We are not saying changing networks causes traffic loss, or predicting how your site will perform.
Download the four worked scenarios as CSV. The file contains examples, not measured publisher accounts.
Find the traffic loss you can afford
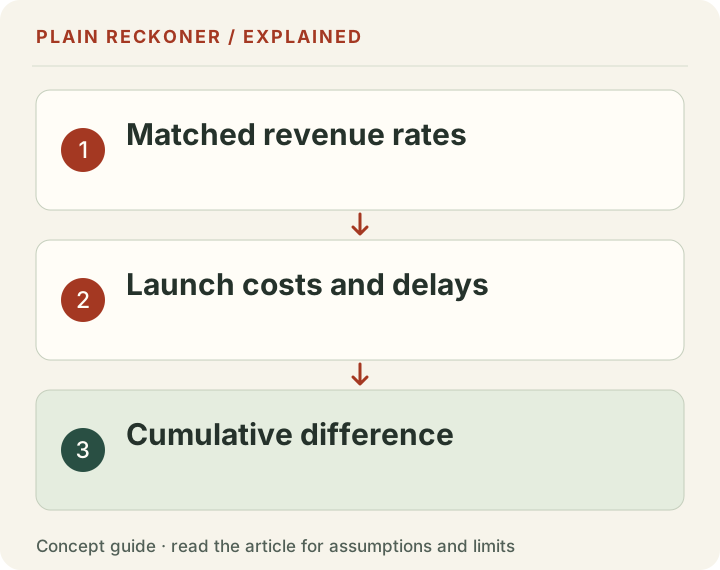
For this example, the switch needs $1,700 per month: $1,500 to match staying, $100 for the extra fee and $100 to recover the $600 cost over six months.
At a $20 page RPM, that requires 85,000 pageviews. Starting with 100,000, the allowance is 15,000 pageviews, or 15%. Below that traffic level, the switch loses money relative to staying under these assumptions.
The formula is:
Affordable traffic loss = 1 − (baseline revenue + extra monthly fee + switching cost ÷ months) ÷ new network revenue at unchanged traffic
Multiply by 100 for a percentage. If the no-loss case already falls short, there is no allowance to spend. If new network RPM is zero, the tool does not invent a useful percentage.
The planning lab updates this limit as you change the inputs. It also shows the new network RPM needed at your chosen traffic loss, the gain over your selected period and simple payback. Your entries are calculated locally; no account is needed.
A benchmark is context, not your offer
We rechecked our published historical RPM records for this guide. The median is $15.21 page RPM, with the middle half between $6.88 and $25.16. These are descriptive quartiles of the stored per-business RPM values, using linear interpolation between ordered observations.
The published research table contains 123 historical, sale-selected display-ad businesses. It is not a random sample of publishers, a current rate card or a test of Mediavine against Raptive. A business appearing as sold does not provide a verified final transaction price.
The spread is a reason to use your own reports. It cannot tell you what RPM a new network will deliver on your site.
Check what happens after a guarantee ends
Mediavine’s switching-cost article makes a comparison over a longer period than the initial guarantee. It is provider-authored marketing with illustrative assumptions, not independent evidence that every competing offer loses money.
Ask the provider for the terms that apply to your site. If the rate changes after an introductory period, calculate the periods separately. Our constant-RPM example does not model a changing guarantee, delayed payments, taxes, variable fees or the value of your own time unless you enter it as a cost.
Keep common cash costs separate from extra switching costs. Common costs cancel when comparing the two options, but still matter to whether the business is profitable at all.
Measure the outcome without fooling yourself
Save the starting reports and the date of each implementation change. Compare complete periods with matching units. Look at revenue, traffic and page RPM together. Break down large changes by country, device and page group where your provider supports it.
If earnings fall, our traffic-up, revenue-down guide helps separate arithmetic changes from possible causes. For eligibility rather than earnings, use the current ad-network requirements guide.
A successful switch is one your evidence supports after costs. Start with the break-even number, then test the assumptions that could overturn it.
Model a changing offer month by month
A single candidate RPM is useful for a simple scenario. It is a poor fit for an offer with a temporary guarantee, a gradual launch or a later fee change. Put those periods in separate rows instead of averaging away the feature that matters.
Take a new chosen scenario with unchanged monthly traffic of 100,000 pageviews. Staying earns $1,500 each month. The proposed network scenario earns $2,500 in each of the first two months and $1,600 in each of the next four. Keep the earlier $100 extra monthly fee and $600 one-time cost.
Swipe or scroll the table horizontally to see every column.
| Period | Candidate revenue | Baseline revenue | Extra recurring fees | Gain before one-time cost |
|---|---|---|---|---|
| First two months together | $5,000 | $3,000 | $200 | $1,800 |
| Next four months together | $6,400 | $6,000 | $400 | $0 |
| Six-month total | $11,400 | $9,000 | $600 | $1,800 |
Subtracting the $600 one-time cost leaves $1,200 ahead for the six months. But after the introductory period, the proposed network scenario only matches staying after the extra monthly fee. The early gain does not establish a continuing monthly advantage.
These rates are explicitly chosen, not actual terms from a provider. The lesson is to inspect each contractual phase. Extending the first two months' rate across the year would describe an offer you do not have. Conversely, ignoring an enforceable temporary guarantee would omit part of the actual offer. Record conditions and exclusions, not only the headline amount.
Simple payback can hide the launch path
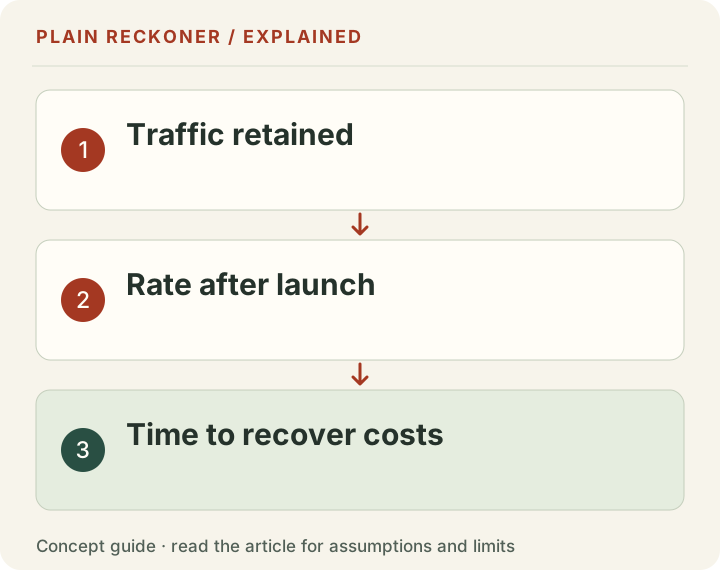
Simple payback divides the one-time cost by a constant positive monthly gain. It is useful when that constant is a reasonable scenario. It is unavailable when the gain is zero or negative, and it becomes incomplete when monthly gains vary.
For a changing launch, calculate cumulative gain. Begin with the implementation cost as a negative balance, add each month's difference after recurring fees and see when the running total reaches zero. If later months become negative, note that an early crossing does not guarantee the switch stays ahead.
Mediavine's launch guidance describes a ramp period that varies with the site, advertising history and timing. That is the provider's explanation, not a measured delay we can assign to every network. Ask the proposed provider how its launch process and any guarantee apply to your agreement.
Keep a launch scenario separate from the steady-state scenario. A weak first week may not describe the settled arrangement. A strong first week may not describe it either. Neither excuses broken setup: verify that the required files and placements work instead of treating every shortfall as a normal ramp.
Earned revenue and cash received need separate calendars
A switch can improve earned revenue while delaying cash you need for operating costs. Record the old provider's final payout timing and the new provider's payment schedule, minimum balance, holds and applicable currency or transfer costs.
Google's AdSense payment timeline is one example of why the distinction matters: estimated earnings accrue during a month, later become finalized and are paid under the account's threshold and hold conditions. That schedule is not a universal payment rule for other networks.
Make a cash calendar with expected receipt dates rather than put the earned amount in the bank column immediately. Include the actual one-time payment and any contractor bills when due. If a date or amount is uncertain, mark it as such. A scenario that needs an early payout to meet a bill should not hide that dependency.
Do not count the same cost twice. If a setup charge is already included in the implementation total, it should not appear again as a recurring deduction. If the quoted publisher-net rate includes the provider's share, it should not be reduced by that share again. Reconcile the monthly comparison and the cash schedule independently.
Check experience without claiming an automatic revenue effect
Readers encounter the ad layout, not the spreadsheet. Test long articles, short pages, calculators, menus and forms with the planned placements. Check that essential controls remain reachable, text does not jump under a pointer and overlays can close.
Google's Web Vitals guidance measures loading, interaction and visual stability. It distinguishes actual visitor experience from a single local observation. A lab test can identify a problem but cannot prove what the full audience experienced after a switch.
Capture comparable tests before and after implementation, on mobile as well as desktop. Use the same pages and conditions where practical. Review real field data when enough exists, and keep traffic and device mix in mind. A different measurement population can change an aggregate even if an individual page did not change.
Do not insert an assumed traffic penalty into the result as though it were measured. Our traffic-loss slider is a stress test. If you later observe a decline, investigate search demand, rankings, referral sources, analytics changes and other releases before blaming the ad network alone.
Compare alternatives with the same assumptions
“Switch” and “stay” are both scenarios. If the site is growing, holding baseline revenue forever may be unrealistic. But assuming all future growth belongs to the proposed network is equally weak. Apply the same traffic scenario to both sides unless you have evidence for a specific difference.
Suppose expected traffic grows ten percent for reasons unrelated to the network. At unchanged $15 and $20 rates, the revenue difference per thousand pageviews still matters, but both options should receive the extra traffic in the model. Otherwise the comparison assigns ordinary business growth to the provider change.
Likewise, costs common to both options cancel in a relative comparison but remain part of business profitability. Hosting can be excluded from the switching difference if it is unchanged, yet the site still has to pay it. A switch can be better than staying while the business as a whole still loses money.
Keep these two conclusions distinct: additional contribution from switching, and total contribution after the site's named costs. They answer different questions and can have different signs.
Leave with a documented decision
Save the provider's applicable offer, the date checked, the current reports, the conversion of traffic units and the complete cost assumptions. Ask about unclear cancellation, exclusivity and payment terms before implementation. This guide explains a financial model; it does not interpret your contract or replace qualified advice when the terms are uncertain.
Choose a review period and a fallback plan. Define the measurements that would support continuing, the technical failures that require immediate action and the evidence needed to distinguish a poor launch from an unfavorable ongoing offer.
Then use the switching planner for the constant-input scenarios it supports. Use a separate monthly worksheet for a changing offer. Do not force a complex contract into a single-rate input and mistake a neat output for a complete decision.
When the offer needs more evidence
Treat an earnings screenshot as a question rather than an offer. Ask whether it describes your site, a comparable site or a broad provider example. Confirm the period, traffic unit, revenue deductions and whether the figure was typical or selected because it was unusually strong.
A projected range is not the same as a contractual guarantee. A guarantee may have conditions about traffic, placement, compliance or timing. Keep the written terms with the scenario and do not assume that a broad marketing phrase overrides them.
If the provider cannot clarify the denominator, you cannot calculate a meaningful rate comparison. If a cost is unresolved, show scenarios with and without it rather than silently set it to zero. If the claim depends on changing your audience, treat that as a separate growth question.
There is no need to force a verdict when the important inputs are missing. An honest unresolved comparison tells you exactly what to ask next and can prevent a costly migration based on a number whose meaning was never established.