
The share of records labeled Amazon affiliate changed sharply in the historical snapshot. That is a useful observation about this broker’s available record. It is not enough to estimate the performance or sale probability of every affiliate website.
The original August 2026 analysis reported Amazon-affiliate labels on 45% of sold-status records for 2020 and 4% for 2026 to the date of collection. The latter was incomplete. For a complete-year comparison, the reported share was 9% in 2025.
Preserve the category definitions
Swipe or scroll the table horizontally to see every column.
| Label in the historical analysis | 2020 full year | 2025 full year | 2026 year to August collection |
|---|---|---|---|
| Commission on Amazon links | 45% | 9% | 4% |
| Commission on other links | 16% | 13% | 4% |
| Display advertising | 18% | 18% | 8% |
| Selling stock through Amazon | 35% | 37% | 53% |
| Own online shop | 11% | 24% | 22% |
A business may carry several labels. These columns therefore do not sum to 100%, and adding the Amazon-stock and online-shop shares does not establish a combined share. Our earlier claim that those groups together represented three quarters of the market was not supported by a deduplicated union.
Shares and volumes are also different questions. A category can occupy more of a smaller total without adding transactions. The complete-year and year-to-date totals should not be presented as if every period had the same duration.
What the record cannot explain
A changing mix could reflect demand from buyers, which owners seek an exit, which businesses the broker accepts, changing labels, feed coverage or several of those factors together. The original article treated business models as a direct measure of search dependence. That was too strong: an affiliate site may have email or direct traffic, and a store may depend heavily on search.
The historical observation does not isolate the effect of a search-engine update, establish that a type of business has stopped selling, or tell an owner what a specific site is worth.
The broker’s API documentation also warns that listings may disappear. A new pull can differ from the archived observation. This October correction changes the interpretation; it does not claim to have recreated the original annual-query results from a single complete transaction archive.
What remains useful
The within-period shares document a changing observed mix and justify further research using stable definitions. A stronger comparison would preserve dated query responses, track coverage changes, separate overlapping labels and compare equivalent completed windows.
For the related display-advertising question, see the corrected complete-year comparison. For valuation, read why listing price is not verified sale price before using the business-model benchmarks.
Correction, 19 October 2026: incomplete-period, overlapping-category and causal claims are now explicit. Evidence grade: A. This is a historical single-broker observation, not a live census, a verified final-price dataset or a forecast for a publisher’s business.
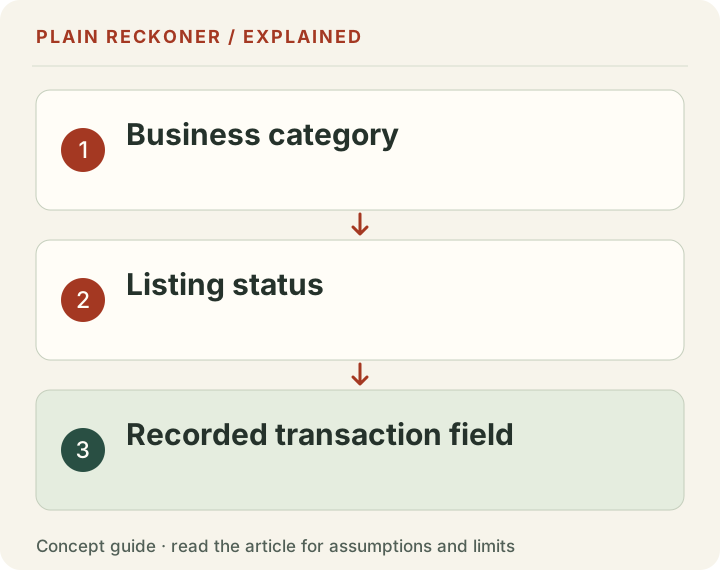
Amazon affiliate and Amazon stock are different businesses
The shared company name can hide an important model difference. Amazon Associates describes earning commission from qualifying referred purchases and actions. A publisher can recommend products without owning the stock sold through those links.
Amazon's Fulfillment by Amazon description describes a fulfillment service for sellers' products. That model involves inventory and operating considerations that an affiliate commission model does not automatically share.
The historical category labels therefore should not be collapsed into “Amazon businesses” when the question concerns one revenue model. The same marketplace can show a lower affiliate share and a higher stock-selling share without those being contradictory observations.
Nor does a business carry only one source of income. A publication can earn display revenue and affiliate commissions. A seller can operate an independent store alongside an Amazon channel. Preserve overlapping tags instead of assume the categories form a pie chart.
A share is a numerator and a denominator
The article's headline now uses the two complete-year shares: forty-five percent in 2020 and nine percent in 2025. The four-percent 2026 figure remains explicitly year-to-date in the historical table. It does not receive the same opportunity to accumulate observations as a complete year.
A percentage share alone cannot tell you the category count. Take a chosen example with forty-five affiliate-labeled records out of one hundred total. That is forty-five percent. Another period with eighteen such records out of two hundred is nine percent.
Those chosen totals illustrate the relationship; they are not the missing counts behind the published historical shares. Without the actual denominators, you cannot infer the absolute count change from the percentage labels alone.
The same share can also arise from very different sizes. Nine out of one hundred and ninety out of one thousand are both nine percent. A market claim needs the counts, coverage and period, not only the rate.
Percentage points and percentage changes need different labels
A move from forty-five percent to nine percent is thirty-six percentage points lower. Relative to the original share, nine divided by forty-five is one fifth, or an eighty-percent reduction in the share.
That does not mean affiliate businesses lost eighty percent of revenue or that an individual site became eighty percent less likely to sell. The measured object here is a category share within a source population.
For the incomplete 2026 share, comparing four with forty-five produces another arithmetic result but leaves the period mismatch. A precise relative percentage cannot remove that mismatch. Keep the complete-year comparison as the main view and discuss the partial observation separately.
Labels matter because the phrase “down eighty percent” can travel without its denominator. Say which share changed and in which dated record. That preserves the useful observation without turning it into a much broader business verdict.
Overlapping labels require a union, not addition
Suppose a chosen source contains one hundred businesses. Thirty carry an affiliate label, twenty-five a display label and fifteen carry both. Adding thirty and twenty-five gives fifty-five tag assignments, not fifty-five distinct businesses.
The number carrying either label is thirty plus twenty-five minus fifteen, or forty. The subtraction removes the overlap counted twice. Without the overlap count or row identifiers, a combined unique share is unresolved.
This is why the historical Amazon-stock and own-store percentages cannot simply be added and called three quarters of the market. Some businesses may be in both groups. The required union needs the actual records and a clear classification rule.
You can choose a mutually exclusive business-model assignment, but state the precedence rule. Classifying a mixed business by its largest revenue source is a different analysis from allowing every applicable label. Neither rule should silently replace the other when comparing years.
Labels can change while the business continues
A site's recorded monetization mix can evolve. It might add ads, remove one affiliate partner, begin selling a product or change how the source describes it. A category count can therefore move without every affected business closing or being sold under a new model.
The historical study does not track all those transitions. It compares source observations with their labels and limits. Do not turn the result into a claim that a specific number of publishers abandoned affiliate income.
A stronger transition study would preserve identifiers across dated snapshots and record which fields changed. It would distinguish a true operating change from a source taxonomy update or a missing label. That work needs the corresponding evidence, not an assumption based on the latest summary table.
Keep classification uncertainty in the record. A vague description should not be forced into the category that makes the trend cleaner. An unknown is more honest than a confident assignment unsupported by the source.
One broker's mix is not the industry's mix
The source frame excludes businesses sold privately, never offered for sale, listed elsewhere or not admitted by this broker. Its own operating strategy and public-feed coverage can affect which records appear.
A source moving toward larger businesses could show a different model mix even if the broader population stayed unchanged. A change in which records remain publicly visible could also affect a retrospective query. These are possible explanations to investigate, not causes established by this article.
The API documentation provides the field and access context for the public source. A current pull should not be assumed to reconstruct an earlier response exactly. Preserve dated query results if you want to compare versions.
That scope does not make the historical observation worthless. It makes it a source-specific finding that can motivate a better study. The limit should remain attached when the chart is shared or used in a business discussion.
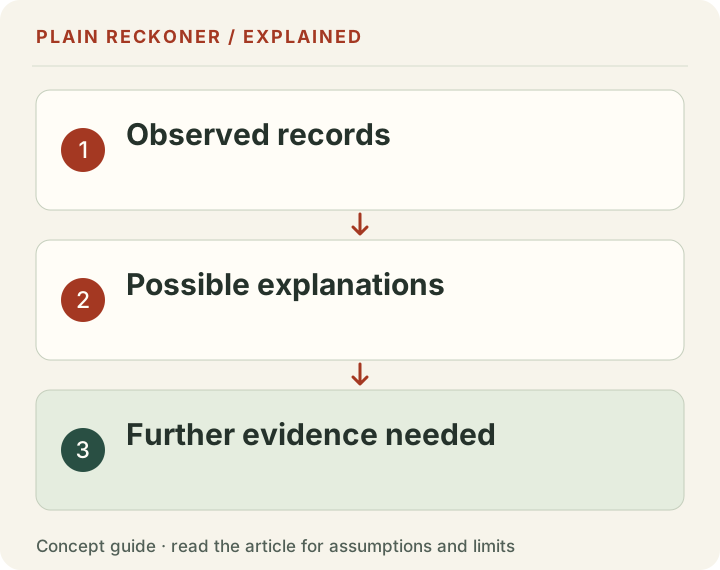
Affiliate does not automatically mean search-dependent
An affiliate publisher can reach readers through search, email, direct visits, community referrals or other legitimate channels. A physical-product seller can also depend on search or paid acquisition. Monetization labels do not measure those traffic-source shares.
To investigate a search explanation, use actual matched acquisition evidence and appropriate dates. A category shift after a search update does not isolate that update from buyer preferences, seller choices, broker coverage or other business changes.
A business can also remain useful while a particular traffic route weakens. The operational question is which readers it serves, what contribution its actual revenue leaves and which dependencies matter to its future. The public category table cannot answer those questions for every site.
Avoid replacing one broad story with its opposite. This finding does not show that affiliate publishing is dead, nor that all worries about it are unfounded. It describes a historical observed mix and the evidence needed to understand more.
Current commission economics need their own check
A historical exit share does not establish today's commission schedule, product availability or account requirements. Use the official program documents for the market and agreement relevant to the site.
For a publisher's own review, separate clicks sent, qualifying actions, recorded commissions, reversals and payments. They are different stages. A high click count does not guarantee a commission, and a commission estimate is not necessarily cash already received.
Then include the costs of producing and maintaining useful content. Hosting, editorial work, original testing and audience development can affect contribution. Revenue alone is not a complete profit measure.
Do not infer a universal commission rate from a broad program headline or an old success story. The source program and the particular qualifying action determine the relevant rules. This article does not supply a current commission forecast for an individual publisher.
A useful owner review starts with the actual business
Gather complete revenue periods by source, matching traffic evidence, operating costs and the work needed to maintain the publication. Note any changes in products, links, audience or measurement.
If considering a sale, separate historical listing benchmarks from verified completed consideration. A sold status and a retained listing-price field are not the same evidence. Review the actual terms and financial records with suitable professional support.
If continuing to operate, use the records to identify the concrete weak point. Perhaps useful pages need updating, product information changed or a source link no longer works. Perhaps the audience still arrives but qualifying commissions differ. Those problems need different actions.
The business-model benchmark can provide bounded context under its own cohort definitions. It cannot decide whether the site should be sold or predict what a buyer will pay. The public historical share is one clue, not the owner's entire strategy.
Build a better update before declaring a recovery or collapse
Define the time window and event date, retain raw query responses and track unique records. Record all model tags, missing fields, source disappearances and the treatment of still-active listings.
Compare the same elapsed period for year-to-date work. Keep full-year analysis distinct. Show counts and shares together, and compute a unique union where a combined group is discussed.
Then check sensitivity to classification. If a precedence rule is used, explain it and show whether a different reasonable rule changes the conclusion. Do not attach the same sample size to a different population without justification.
A wider set of sources could improve coverage only if the definitions and permitted uses align. More scraped rows cannot automatically resolve a mismatch between asking records, completed deals and private estimates.
The strongest next result would be a reproducible comparison with clear evidence, even if it is less dramatic than the old headline. That is what makes the observation useful for publishers rather than another confident market story.
Preserve the difference between history and a current check
This article's source shares remain the historical August observation. Reopening a program definition today verifies the current description of affiliate or fulfillment services; it does not refresh the old broker counts.
A later article edit should make that distinction visible. Keep the original collection date, the new source-review date where appropriate and the exact statement supported by each. A recent modified date is not a new market census.
If a future snapshot gives another share, compare the raw populations before describing a trend. Did the source add records, remove older ones, revise labels or change the query behavior? Those checks can distinguish a business shift from a reporting difference.
For readers sharing the chart, retain the full-year labels and source scope. Do not crop away the note that the categories overlap. A careful analysis can become misleading when a social preview reduces it to “affiliate exits disappeared.”
The practical takeaway is narrower and more useful: this source's observed affiliate share was lower in the stated complete-year comparison, and understanding why needs additional evidence. That finding can inform research without pretending to forecast an individual owner's outcome.