
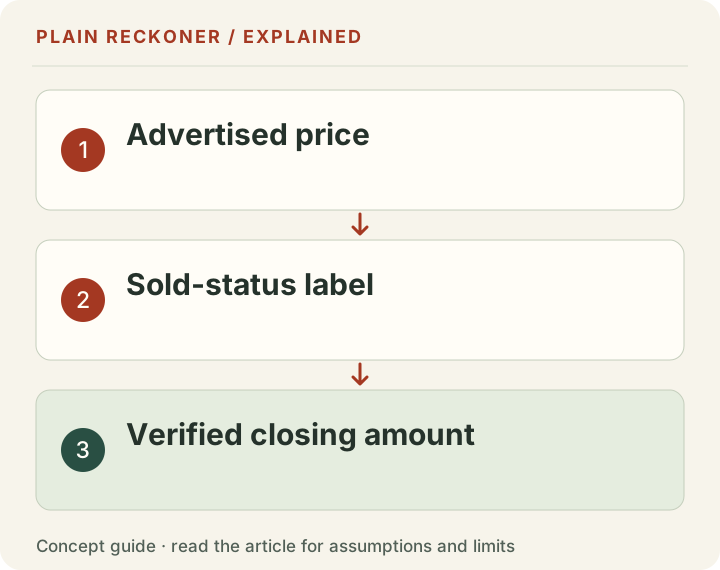
A business marked sold can still have a public listing-price field that does not establish the closing amount. We needed to correct that distinction in Plain Reckoner’s valuation descriptions.
Empire Flippers’ 2026 State of the Industry report, page 6 separates listing and sales metrics. For 2025 it reports an average listing price of $310,037 and average sale price of $270,802.75. Its average monthly listing multiple is 28.69; the monthly sales multiple is 23.93.
Those are provider-reported aggregates across its marketplace, not our independently checked transaction records. They nevertheless make the distinction explicit: the publication does not use listing and sale as interchangeable labels.
Download the four reported 2025 aggregates, with the source page and units preserved.
What the API fields actually establish
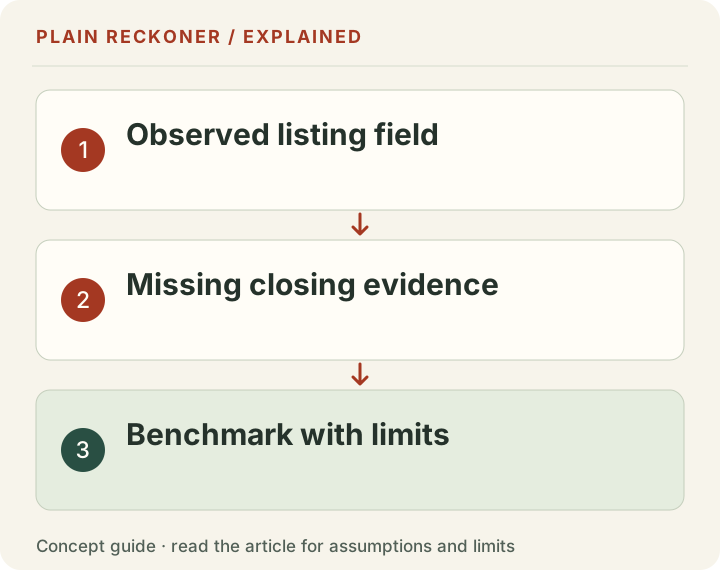
The public marketplace API documentation describes listing data and distinguishes listing-related and sale-related sort fields. Our saved snapshot contains listing_price, listing_multiple and listing_status for the records used in the calculations. It does not contain a verified closing-price field for those rows.
Filtering that snapshot to Sold answers which records have that status. It does not establish that the accompanying listing price equals what a buyer ultimately paid. A status filter and a price definition answer different questions.
The same care applies to dates. A listing year is not necessarily the year a transaction closed. An analysis grouped by first listing date must describe that grouping rather than labeling it a closed-deal time series.
Why the obvious discount calculation would still be wrong
Subtracting the reported average sale price from the average listing price gives $39,234.25. That arithmetic is correct. Calling it the typical seller’s discount would require more evidence.
The report’s aggregate listing and sale populations need not contain the same businesses or the same time windows. A difference between two averages is not automatically the average negotiation outcome for matched deals. It also does not tell us how the difference varies by business model, size, profitability or transaction terms.
For that reason we do not reduce every tool result by a percentage derived from these aggregates. Applying a guessed haircut would replace one unsupported interpretation with another.
How to interpret the downloadable listing data in Plain Reckoner
Our display and business-model tools retain the historical multiple calculations, but describe them as listing benchmarks for records marked sold, not confirmed prices buyers paid. Their ranges summarize those listing records; they are not predictive confidence intervals for your future exit.
The business-model dataset now identifies the listing-price field and records the correction. Existing historical figures have not been silently turned into a different measurement. Archived deposits may preserve older column names or descriptions; the current page explains the difference.
The earnings dataset is a separate question: page RPM is calculated from traffic and advertising revenue, rather than from the listing-price field. Correcting the valuation interpretation does not independently reverify that revenue, refresh its measurement date or establish network-specific performance.
How to check a valuation benchmark
Before using a multiple, record whether its price is asking, listing, accepted offer or completed closing consideration. Check whether it uses monthly or annual profit, SDE or EBITDA, and whether earn-outs, inventory or fees are included. A benchmark is only comparable when those definitions align.
Our display valuation tool and business-model tool offer bounded historical comparisons. They cannot inspect your private accounts or provide a verified sale appraisal. Keep those limits beside the result, especially when the figures may influence a financial decision.
Evidence grade: A. Provider aggregates and an auditable field-definition correction. There is no newly verified transaction-level sale-price dataset or guaranteed valuation here.
September 2026 changed the displayed unit, not the price
Empire Flippers' annual-multiple announcement is dated 8 September 2026. It says the marketplace changed from monthly to annual multiples without changing the underlying listing prices. That is a documented interface change, not a sudden market-price fall.
For a chosen example, a business earns $2,000 average monthly profit, or $24,000 on the corresponding twelve-month basis. A $60,000 listing is thirty times monthly profit and two and a half times annual profit. Both ratios describe the same price and profit assumption.
Comparing an old screenshot showing 30× with a new one showing 2.5× would imply a dramatic decline if you ignored the units. Dividing the monthly multiple by twelve produces the annual equivalent under the matching profit basis. Multiplying the annual multiple by twelve reverses it.
This conversion does not repair a different profit definition, period or price field. A 30× monthly asking multiple and a 2.5× annual closing multiple may happen to match numerically after conversion while still describing different evidence. Normalize the unit, then inspect the remaining scope.
A price field needs an event definition
An asking price is an owner's or intermediary's offer. An accepted offer records another stage. A completed transaction has its own terms, timing and consideration. A listing status alone does not define every monetary field beside it.
If a dataset says sold and shows a price, ask whether the source identifies that amount as the closing consideration or merely retains the last listing value. Check the field documentation and a sample of actual records. Do not infer semantics from the most convenient interpretation of the status.
The saved records behind our historical benchmark contain listing-price fields. We can calculate ratios from those fields and study their distribution. We cannot rename them verified closing prices because the status changed.
This remains true even if a particular listing happened to close at its asking price. One matching case would not establish that every row behaves that way. A broad claim needs consistent source definitions or transaction-level verification.
The profit denominator matters as much as the price
A price-to-profit multiple changes when the profit basis changes, even if the price stays fixed. Revenue, gross profit, operating profit, SDE and EBITDA are not interchangeable inputs.
Take a chosen business listed at $60,000. If the relevant monthly profit is $2,000, its monthly multiple is thirty. If a fuller cost review gives $1,500 under a different defined profit basis, the same price is forty times that monthly amount.
That does not establish that the seller raised the price or the market became more expensive. It means the denominator changed. State which owner costs, recurring expenses and adjustments are included before comparing multiples.
Owner work deserves explicit treatment. A profit measure before paying the working owner may differ materially from the amount available to an absentee buyer who needs to hire a replacement. A benchmark cannot choose that replacement cost without evidence.
Keep the original financial statement basis and any buyer-specific operating scenario separate. Both can be useful, but silently substitute one for the other and the comparison loses its meaning.
A headline deal value can include different kinds of money
A transaction may combine cash at completion, later payments, a seller note, inventory or performance-based consideration. Those terms can have different timing and uncertainty. The number described as the deal value needs a clear inclusion rule.
This guide does not interpret a particular agreement. It asks you to identify what the price includes before comparing it with another source. A public asking-price record usually cannot establish how an undisclosed final payment structure works.
For a chosen illustration, a stated $100,000 package with $70,000 paid at completion and $30,000 conditional on later performance is not the same cash timing as $100,000 unconditionally paid at completion. The appropriate valuation of the conditional portion would need its terms and assumptions; we do not assign one here.
Likewise, a price including inventory should not be compared directly with a price excluding inventory without an adjustment you can support. A net amount received by the seller after fees is another different measure. Name the amount rather than call all of them the sale price.
Why a difference between aggregates is not a negotiated discount
The report's average asking and average sale figures summarize populations. To estimate negotiation outcomes, you would need matched asking and closing values for the same deals, with a defined stage for the asking price.
Consider a separate chosen example. Two listings ask $50,000 and $150,000, giving an average ask of $100,000. If only the $50,000 listing sells at that exact price, the average sold price is $50,000. Comparing the two averages suggests a fifty-percent gap even though the one completed transaction had no discount.
The missing deal explains the difference in populations. It is not evidence that every seller accepted half the ask. Other mixes could produce a higher average sold price than average ask without a matched transaction premium.
Even with matched deals, define the comparison carefully. First ask, last ask, accepted offer and final consideration can differ. A percentage change needs its denominator, and averaging dollar differences differs from averaging percentage differences. The useful question determines the calculation.
Listing year and closing year can tell different stories
A record first listed late in one year may close in the next. Grouping it by the listing date answers when the offer entered the market. Grouping by a verified completion date answers when the transaction finished.
If your source has only a listing date and sold status at collection, it cannot automatically produce a complete closing-year series. The date when you observed the status is another event again.
This matters most near the latest year, where incomplete follow-up can leave recent listings with less opportunity to sell. A low count in a partial year is not directly comparable with all transactions from an earlier full year.
Keep the cohort label visible in charts. “Sold-status records first listed in 2025” is less compact than “2025 sales,” but it preserves the actual question. Shortening the label should not change the meaning.
Use a historical range as a sensitivity tool
A historical listing distribution can help examine how a chosen multiple affects a profit scenario. It does not provide a confidence interval for the price your business will receive.
For a chosen $2,000 monthly profit, twenty, thirty and forty times monthly profit imply $40,000, $60,000 and $80,000 listing scenarios. The spread shows sensitivity to the assumed multiple. It does not assign probabilities to those outcomes or identify which buyer would offer them.
Then examine profit sensitivity separately. If profit falls from $2,000 to $1,500 at a constant thirty-times multiple, the listing scenario falls from $60,000 to $45,000. If both the profit and multiple change, state both assumptions rather than attribute the whole difference to the market.
The website-value tool offers this kind of bounded benchmark context. It cannot review private books, assess every risk or replace an appraisal or transaction adviser. A well-labeled scenario remains useful without pretending to be a quote.
A source checklist before using any valuation table
Record the price type, profit type, monthly or annual unit, financial window, listing or completion date, marketplace coverage and any transaction terms included. Add the observation date and source version.
Inspect what is missing. No closing field means no verified closing-price claim. No cost details means the profit basis may be uncertain. No matched deal identifiers means an aggregate gap cannot become a seller discount estimate.
For a public data analysis, publish the field definitions and exclusions. For a private transaction, use appropriate professional diligence and the actual agreement. Those two workflows can inform each other but do not have the same evidence.
The practical goal is a comparison another person can reproduce and interpret. A smaller, clearly defined benchmark is more valuable than a large table that confuses asking prices with completed consideration.
What to do when the source wording is unclear
Ask the source owner the exact question: which field, which event and which financial period? Keep the response with the dataset version. Do not patch uncertainty by subtracting an arbitrary percentage from every estimate.
If the meaning remains unresolved, label the field as the source labels it and state the limit. You can still use it for a narrower listing comparison while leaving transaction claims unavailable.
When you share a chart or tool result, preserve that label beside the number. A screenshot that drops “listing” can undo the whole distinction. The professional result is a useful scenario with its evidence intact, not a confident sale price assembled from a status flag.
Keep seller proceeds separate from the buyer's price
Even a verified completed price is not automatically the amount the seller keeps. Brokerage fees, professional costs, debt settlement and applicable tax treatment can affect the seller's outcome. Those amounts need the actual terms and appropriate advice; this article does not estimate them.
For a chosen arithmetic example, $60,000 of price less $6,000 of named transaction costs leaves $54,000 before other excluded obligations. That does not change the price-to-profit multiple quoted on the deal. It creates a separate net-proceeds measure.
A buyer's acquisition cost can also include items outside the seller's received amount. Keep the two perspectives explicit when budgeting. Comparing a seller's net proceeds with another deal's headline asking price mixes measures just as surely as comparing a monthly multiple with an annual one. Clear labels are part of the calculation, not optional footnotes.
What a website valuation calculator can and cannot value
A website valuation calculator based on listing records gives context about asking-price multiples under stated assumptions. It does not establish the final amount a buyer paid. A seller may change the asking price, negotiate terms or withdraw the business. Keep those outcomes separate from verified completed transactions.
Website domain valuation is also a different task from valuing an operating website. The domain alone does not include the same content, customer relationships, revenue history, expenses or transfer work. Do not compare a domain appraisal directly with a profit-based business multiple.
To value a website for sale, begin with the profit definition, period and costs. A 24× monthly-profit assumption is equivalent to 2× annual profit when the monthly and annual profit bases match. That conversion does not validate the multiple itself. The value tool keeps the unit and assumptions visible so you can compare a scenario without treating it as an appraisal.