
The full-year comparison is 138 records in 2022 versus 31 in 2025. That is a 77.5% decrease in the historical count, not proof that the entire website market or every publisher experienced the same decline.
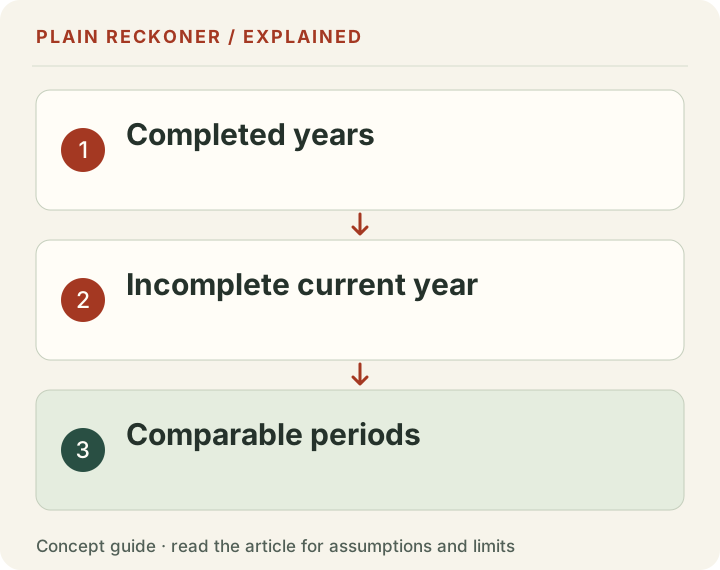
This article corrects an August 2026 analysis. Its former headline compared a complete 2022 with an incomplete 2026 and called the difference a 93% decline. That comparison did not give both years the same opportunity to accumulate sales.
Keep incomplete years separate
Swipe or scroll the table horizontally to see every column.
| Business label in the historical record | 2022 | 2023 | 2024 | 2025 |
|---|---|---|---|---|
| Display advertising | 138 | 77 | 35 | 31 |
| Commission on links | 89 | 45 | 19 | 22 |
| Selling stock through Amazon | 81 | 50 | 46 | 62 |
The earlier 2026 count was nine display-advertising records as of the August observation. It was not a completed-year total, a forecast of the year-end result or a directly comparable full-year decline. We have removed it from the annual chart rather than projecting a final year from it.
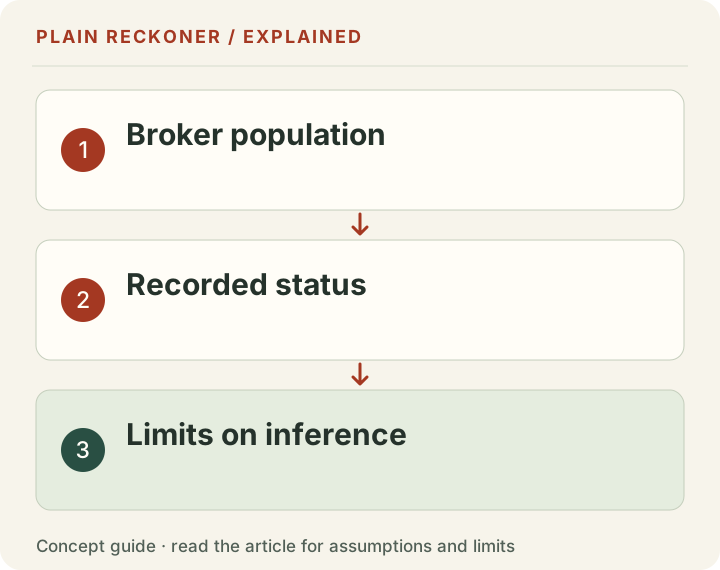
These are the historical values published in the original analysis. This correction does not claim that a fresh query of a changing marketplace API would return an identical record. The broker’s API documentation notes that listings may disappear for internal reasons. A public feed is a view of available records, not a permanent census of every transaction.
What the decline does and does not establish
The display count fell more sharply than the Amazon-stock count in the full-year comparison shown here. That is an observable difference between labeled groups in one broker’s record.
It does not establish the reason. Seller willingness to list, buyer demand, broker acceptance, category labels, coverage and the businesses represented could all change. The comparison groups are not a randomized control, and monetization labels do not directly measure dependence on search.
The previous article said the ad market was fine and the audience was gone. That causal conclusion was stronger than this evidence permits. Different historical RPM and traffic samples cannot, by themselves, identify the cause of changing sales counts.
Keep valuation evidence separate
The snapshot’s price fields also require care. A record marked sold has a status; its listing_price field is not independently verified closing consideration. Our listing-versus-sale correction explains the distinction using the broker’s own separately reported aggregates.
The historical multiple comparison describes listing multiples by the year a business was listed. That is a different grouping from a sale-date count, and the two should not be merged into one story without checking the dates and populations.
A better way to use this observation
Use the historical counts to ask narrower questions: whether a particular broker’s mix changed, which records remain publicly available, and whether equally defined periods tell the same story. For your own site, inspect actual revenue, traffic sources, costs and business continuity rather than treating a market headline as a forecast.
Correction, 19 October 2026: unequal-year comparisons, unsupported search causality and final-price language have been removed. Evidence grade: A. This preserves a dated observation with its limits; it is not a new live measurement of the whole market.
A count of completed-status records is not a sale probability
To estimate the chance a listed site sells, you would need the relevant population of listings and enough follow-up to observe their outcomes. Counting only records already marked sold does not provide that denominator.
Suppose a chosen marketplace has twenty sold-status display records. If twenty-five display sites were offered under comparable conditions, that is a different context from two hundred offered sites. The same sold count does not distinguish those situations.
Even a ratio of sold to offered needs careful timing. A recent listing has had less opportunity to complete than one offered a year earlier. Withdrawn listings, changed categories and missing source records also need explicit treatment.
The historical counts in this article therefore describe the available sold-status record, not an individual owner's probability of finding a buyer. They cannot tell a publisher that their own site has a 77.5% lower chance of selling.
Full years fix one problem, not every problem
Comparing complete 2022 and 2025 windows removes the obvious unequal-duration issue. It does not make the underlying marketplace populations identical or guarantee complete archival coverage.
A broker can change its admission criteria, target size, business-model mix or public reporting. Owners can choose other routes or decide not to sell. Buyers can prefer different assets. The available record can reflect several changes at once.
The current broker scoreboard presents provider aggregates with its own definitions. It is another useful view of the source's activity, but it should not be spliced into an old query table without checking the population and date basis.
Likewise, the broker's 2026 industry report supplies provider-reported marketplace context. It does not turn our saved category query into a complete multi-broker census. A current aggregate and a historical source snapshot remain different evidence.
Why annualizing the partial year would add assumptions
A simple projection could multiply an incomplete-year count by the ratio of twelve months to observed months. That requires an assumption about the unobserved period. It is not a measurement of completed future sales.
Take a chosen example of eight observed records in eight months. Multiplying by twelve divided by eight gives twelve projected records for the year at the unchanged monthly pace. The final months could be busier, quieter or affected by reporting delays. The projection is conditional on that pace assumption.
This article does not use such a projection to repair the earlier headline. It keeps the incomplete year separate and uses complete years for the stated comparison. That avoids turning a simple extrapolation into a dramatic annual claim.
For ongoing monitoring, show the year-to-date value and the same elapsed period in earlier years where comparable records exist. Keep the full-year view alongside it rather than merge the two into one unlabeled trend.
Category labels are not traffic-source measurements
Display advertising describes a monetization label. It does not directly measure the share of visits from Google, email, social platforms, referrals or direct navigation. A store can depend heavily on search while an ad-funded publication has a strong returning audience.
The comparison with Amazon-stock businesses therefore does not hold search exposure constant. It compares labeled business groups whose other characteristics may differ.
To study whether search dependence explains sale outcomes, you would need actual matched traffic-source evidence and an appropriate design. Public category tags do not supply that information. An association with a search update would still require checking other changes and timing.
Keep the observation and hypothesis in different sentences. The record count fell in this source. Search changes are one possible subject for further investigation. The first statement is not proof of the second.
Price, multiple and record count are three views
A marketplace can show fewer records while the remaining businesses have higher average prices. That might reflect a shift toward larger businesses, not a contradiction. It can also show lower listing multiples while dollar prices remain stable if the profit denominator changes.
For a chosen example, ten businesses priced at $100,000 each imply $1 million of asking value across those listings. Five businesses priced at $300,000 each imply $1.5 million. Fewer records do not automatically mean a lower total dollar amount.
Those are listing scenarios, not transaction revenue. The example separates count from size. A real market comparison needs the actual price event, terms, profitability and source coverage.
Likewise, the 138-to-31 count difference cannot establish an average sale-price decline. Our multiple study uses its own cohorts and listing fields. Keep that distinction when interpreting a chart or sharing a screenshot.
A falling category share can occur without fewer category records
Share uses the total source population as its denominator. Suppose a chosen category has twenty records out of one hundred, a twenty-percent share. If it still has twenty while the total grows to two hundred, its share falls to ten percent even though its count is unchanged.
Conversely, a category can gain share in a shrinking total while its own count falls. Twenty out of one hundred is twenty percent; fifteen out of fifty is thirty percent. The category has fewer records and a larger share.
That is why the affiliate category-share article answers another question from this count table. It must preserve both its denominator and its overlapping-label rules. Do not use a share decline as a substitute for an absolute volume decline.
The same care applies to a claim about the whole industry. A single broker's composition can change while other marketplaces or private transactions move differently. The source frame defines the reach of the finding.
What a publisher can inspect without waiting for a market verdict
Start with the site's own completed revenue periods, costs, workload and audience sources. Check whether the records can be reproduced. Identify any recent measurement change before interpreting a trend.
A publisher planning to keep operating needs to know whether the business can fund useful content and its recurring commitments. A publisher planning to sell needs clear financial records and an understanding of the actual terms and diligence required.
The historical broker count can encourage a more careful review of assumptions, but it cannot tell the owner to exit immediately or guarantee that waiting will improve the price. Those are individualized decisions requiring more evidence than this public table supplies.
Use the revenue comparison tool for matched period arithmetic and the listing benchmark tool for bounded historical scenarios. They answer narrower questions than whether the market will buy the site.
Separate operational resilience from a claimed market cause
It can be sensible to understand concentration in traffic or revenue even without proving what caused this historical pattern. A business dependent on one source can test what a lower-volume scenario would mean for its costs and cash.
A chosen thirty-percent traffic reduction at a constant earnings rate produces thirty-percent lower revenue. If some costs remain fixed, profit can fall by a larger proportion. That is a conditional stress calculation, not a probability estimate or a diagnosis of the source decline.
Then ask what evidence supports a response. Better source records, more useful content, reliable technical operation and a clear audience purpose can improve the quality of the decision. They do not guarantee traffic, earnings or a sale.
Avoid relabeling every proposed improvement as “AI resilience” without measuring the actual dependency. A transparent stress scenario is more useful than a score that claims to know how search and buyers will behave next year.
Design a stronger market update before collecting more rows
Define the question first: counts by verified completion date, source category mix, time to sell or listing-price expectations. Those require different fields and denominators.
Preserve dated source responses, unique identifiers, category tags and the relevant event dates. Track additions and disappearances across snapshots. A source record that vanishes should not silently become a failed sale or a completed sale.
Use mutually exclusive categories only if you have a documented precedence rule. Otherwise retain overlapping tags and avoid adding their counts as though they were independent businesses. Record missing fields and date ambiguities.
A broader multi-source comparison would also need consistent rights and definitions. Collecting more public pages is not enough if one source reports asking prices, another accepted offers and another verified completions. The alignment work is part of the measurement.
Keep the historical record visible without inventing new data
This revision improves interpretation of the saved observation. It does not claim that the API was re-queried to reconstruct every original annual response, or that the historical data became complete because the article is longer.
A maintained research page should state which evidence remains historical and which source documentation was checked later. That lets readers assess the result rather than mistake a recent edit date for a current market census.
The useful conclusion stays narrow: the published complete-year display counts were lower in the stated historical broker record, and several stronger causal or market-wide interpretations do not follow. That is enough to justify better questions without a forecast the evidence cannot support.
A checklist for sharing this chart
Keep the source and August observation date in the caption. State that the bars are complete-year historical counts from the available sold-status records. Do not relabel them as a census of all website transactions.
Retain the business-label definitions. If a record can carry several labels, the displayed category counts should not be added into a unique total without deduplication. If the underlying query used a particular date field, that field belongs in the reproduction record.
Show the incomplete latest year separately if it is discussed. A reader should not have to inspect a footnote to discover that one bar covers only part of the year. The full-year chart here excludes that value for this reason.
Finally, keep causal language out of a descriptive caption. The chart can say the count fell. It cannot say a particular algorithm, ad network or buyer decision caused the fall without additional evidence. A dramatic explanation is not made more reliable by putting it next to real numbers.
If another source later provides a different count, compare definitions and coverage before deciding one must be false. Two records can legitimately answer different questions. The task is to establish the difference, not choose whichever number supports the stronger headline.