
Recorded listing multiples fell across the three business-model groups in this historical comparison. That observation is narrower than saying every seller received a particular discount or that one cause explains the market.
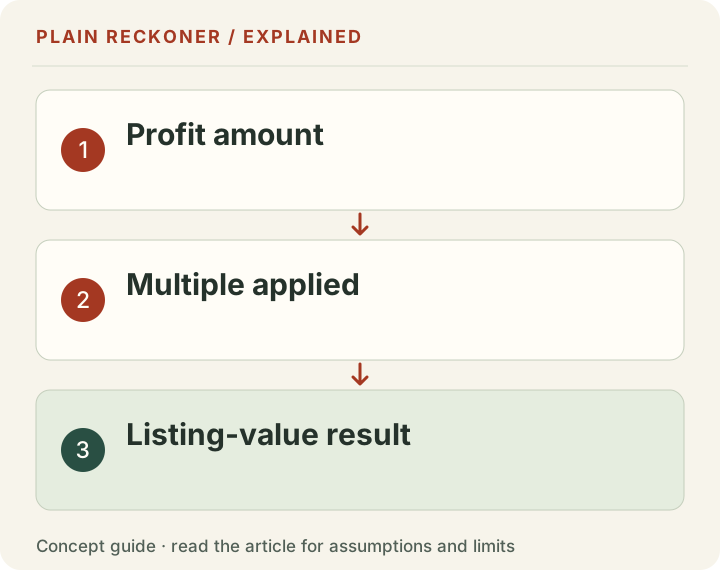
A listing priced at $86,000 against $2,000 in average monthly SDE carries a 43x monthly multiple. SDE is the profit measure before paying the owner for their labor. Neither the multiple nor the listing price establishes the eventual closing consideration.
Display-advertising listing cohorts
| First listing year | Median listing multiple | Sold-status records |
|---|---|---|
| 2021 | 43x | 117 |
| 2022 | 43x | 135 |
| 2023 | 38x | 78 |
| 2024 | 33x | 32 |
| 2025 | 29x | 21 |
The archived snapshot also contains six records first listed in 2026 with a median of 31x. That year was incomplete at collection. We keep it out of the full-year chart and do not call six records a recovery trend.
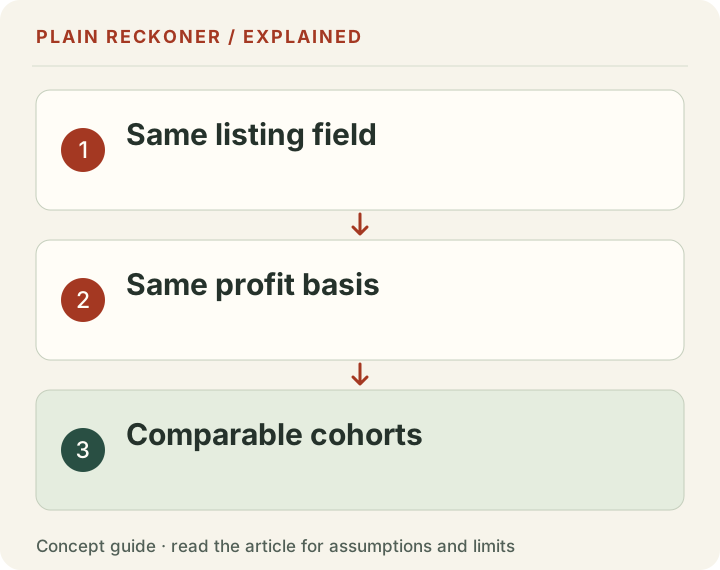
The grouping is by first listing year, not closing year. The records have sold status when observed, but the price field is a listing field. The broker’s API documentation distinguishes those concepts, and its aggregate report separately reports listing and sale metrics. See our field-definition correction.
Compare the same field across groups
Swipe or scroll the table horizontally to see every column.
| Historical group | 2021 median | 2023 median | 2025 median |
|---|---|---|---|
| Display advertising | 43x | 38x | 29x |
| Earning through Amazon | 42x | 36x | 30x |
| Products, services, subscriptions and sales leads | 42x | 29x | 29x |
The rounded display values imply about a one-third decrease. The other rows show similar directional changes. These are selected marketplace groups, not a matched experimental control. A label such as products or services does not establish that the business is independent of search traffic.
We cannot identify borrowing costs, algorithm changes or any other factor as the cause from these tables. Nor can we claim that final sale prices fell by these same amounts. The corrected sales-count article is a separate observation with separate date and coverage limitations.
Sensitivity to the profit window
The historical analysis also restricted records to twelve-month profit windows. The reported changes were about −35% for display, −30% for Amazon and −30% for the products/services/subscription group, compared with about −33%, −29% and −31% without that restriction.
That check reduces one comparability concern: different profit windows can move a multiple without a corresponding change in price. It does not eliminate differences in business size, age, growth, broker coverage or cohort composition. It also does not convert listing data into verified closing data.
How to use the comparison
Use this as context for historical listing expectations, with dates and definitions attached. Check whether another source quotes monthly or annual profit, SDE or EBITDA, and listing or completed transaction consideration. A 29x monthly profit multiple is about 2.42x annual profit, not 348x annual profit.
Our display benchmark tool uses its own documented recent-cohort sample and a modeled SDE margin; it is not a niche-specific appraisal. The business-model tool uses a different cohort definition and takes monthly net profit directly. Do not expect different populations to have identical medians.
Correction, 19 October 2026: final-price language, unequal-period claims and causal conclusions have been removed. The calculations remain reproducible from scripts/measure-rpm.mjs --multiples and the saved snapshot. Evidence grade: A: a historical observational listing comparison, not a verified closing-price study.
A lower multiple and a lower price are not identical claims
A multiple divides a defined price by a defined profit measure. It can move because the price changed, profit changed or the mix of businesses changed. The historical table does not hold every business constant across years.
For a chosen example, a business listed at $86,000 against $2,000 monthly profit has a 43-times monthly multiple. If the price stays $86,000 while the relevant profit becomes $2,966, the ratio is close to twenty-nine. The lower ratio alone does not establish a lower dollar asking price.
For another chosen comparison, keep profit fixed at $2,000. A forty-three-times multiple implies an $86,000 asking scenario, while twenty-nine times implies $58,000. That is a $28,000 difference under a fixed-profit assumption. It illustrates the multiple change without claiming that one matched historical business experienced it.
Keep those two comparisons separate. The table observes cohort medians. A scenario translates the medians into dollars under an input. Neither creates a matched transaction record that the source did not provide.
The unit changed on the live marketplace in September 2026
Empire Flippers' annual-multiple announcement says its displayed multiples switched from monthly to annual units on 8 September 2026 without changing listing prices. That reporting event is separate from the historical pattern in this article.
Forty-three times monthly profit corresponds to about 3.58 times annual profit under the matching twelve-month basis. Twenty-nine times monthly profit corresponds to about 2.42 times annual profit. Converting units changes the number on the label, not the economic ratio.
Do not compare an old 43× screenshot with a new 2.42× screenshot and attribute the entire numerical difference to market compression. First normalize the unit and profit basis. Then compare like cohorts and price definitions.
The conversion also does not establish a closing amount. A monthly listing multiple and an annual sales multiple can describe different price events even after the units are aligned. The broker's 2026 report separates aggregate listing and sale measures; our saved records remain listing evidence.
Cohort composition can change the median
The businesses first listed in 2021 are not the same businesses first listed in 2025. Their size, age, growth, audience, operating demands and revenue mix can differ. A cohort shift can therefore affect a median even if every matched type of business had a stable price relationship.
That is why the comparison groups are descriptive checks, not experimental controls. Similar direction across three broad groups shows the observed pattern was not limited to the display label in this source. It does not isolate a market-wide cause or establish every submarket moved equally.
A category such as products, services or subscriptions can still include search-dependent businesses. An Amazon-related label can combine different operating models. The grouping rule makes the calculation reproducible; it does not make each group economically uniform.
Read the record count beside every cell. A median from twenty-one records has a different evidential base from one from a hundred thirty-five. A six-record partial year needs particularly cautious interpretation. The exact integer displayed is not a precision guarantee about the wider market.
Sold-status selection creates another boundary
The analysis selects records marked sold at the observation date. That leaves out listings still for sale, withdrawn opportunities and businesses never offered through this broker. It is not a census of every owner who wanted to sell.
The selection can interact with timing. Recent listings have had less time to reach sold status by collection. A first-listing-year cohort observed partway through a later year may therefore contain a different subset than an older cohort.
A low count in the latest cohort does not establish that the year's final deal total will be low. A higher median among the few completed-status records does not establish a recovery. Keep the partial period separate from full-year rows.
The same issue limits causal narratives. The snapshot does not show which owners decided not to list, which buyers never made offers or what every failed negotiation would have produced. Do not fill those missing outcomes with a confident market story.
The profit window needs a consistent definition
A multiple based on a short strong period can look lower than one based on a full year, even with the same asking price. Seasonality, growth and one-off costs can affect the profit denominator.
The twelve-month restriction in the historical sensitivity check addresses part of that issue. Similar directional changes under that restriction support the stability of this particular comparison. They do not remove every difference between the cohorts.
For your own business, preserve the financial period and the treatment of adjustments. A seller's discretionary earnings figure may differ from the amount an absentee buyer can keep after replacing the owner's work. Revenue is another measure entirely.
Do not enter revenue into a profit-based benchmark merely because it is the most visible dashboard amount. The resulting multiplication may be arithmetically valid while answering the wrong economic question. Keep the operating-cost basis beside the estimate.
Borrowing costs and search changes are hypotheses here
It is tempting to attach the observed decline to a familiar explanation: interest rates, search volatility, AI answers or buyer caution. Those could be relevant hypotheses. The tables alone do not identify their causal contribution.
To investigate a cause, you would need an appropriate design, matching dates and variables that distinguish competing explanations. A provider's commentary can describe its perspective, but it does not turn this historical listing dataset into a controlled study.
Likewise, a decline across several categories does not prove a single common cause. Different groups can move in the same direction for different reasons. A comparison should state what it observes before discussing what might explain it.
This restraint does not make the finding empty. Knowing that asking-multiple expectations shifted in the selected historical source is useful context. It simply cannot tell an individual seller which risk a buyer priced or what final offer to expect today.
Translate the benchmark into a decision carefully
Suppose an owner wants to evaluate whether a proposed operating improvement could matter to a listing scenario. Keep the multiple fixed and vary the supported profit input first. Then hold profit fixed and examine a range of historical multiples.
For a chosen $1,000 monthly profit, twenty, thirty and forty times monthly profit imply $20,000, $30,000 and $40,000 asking scenarios. At $1,200 monthly profit, those become $24,000, $36,000 and $48,000. The grid shows sensitivity to two assumptions, not a distribution of future buyer offers.
Do not assign probabilities to those cells from the historical quantiles alone. The individual business may differ from the sample, and closing terms remain unknown. Use the exercise to see how much the decision relies on a favorable profit or multiple assumption.
For an actual sale, review the accounts, assets, workload, risks and transaction terms with suitable professional help. A free historical calculator can frame a question without becoming an appraisal or a substitute for diligence.
Use the comparison to improve records before marketing claims
A seller can make the business easier to evaluate by reconciling revenue and costs, documenting the owner's work and preserving source evidence. That does not guarantee a higher price, but it reduces avoidable ambiguity in the discussion.
A buyer can ask whether a quoted multiple uses the same profit measure as the historical comparison and whether the listed price includes inventory or other consideration. Those questions are more useful than treating a broad median as a bid instruction.
A publisher writing about the trend should keep the source, listing-year unit and closing-price limitation near the headline. Do not convert the table into a claim that every website sold for one third less or that a new business cannot succeed.
The public dataset's value is reproducibility. Its limit is scope. Keeping both visible makes the observation suitable for a serious decision rather than a dramatic but unsupported market verdict.
What would strengthen a future update
Collect comparable source snapshots with clear listing and completion dates, verified price-event definitions and consistent financial periods. Track additions, withdrawals and still-active records rather than only the latest sold-status subset.
Preserve the business-model classification and explain any changes. A record moving categories can alter both medians without a price change. A revised source field can require a new interpretation without creating a new historical event.
Report sample sizes, missingness and sensitivity to grouping choices. More observations can improve a source-specific estimate while leaving single-broker selection unresolved. A wider, legitimately usable set of sources would answer a broader question only if the fields can be aligned.
Until then, use the listing benchmark tool with its stated cohort and cost assumptions. Keep historical asking expectations separate from current completed consideration. A useful result helps you inspect the range of possibilities without pretending the market supplied a personalized quote.
Keep a chart honest at a glance
Label the vertical values as monthly-profit listing multiples, not dollars or verified sale multiples. Label the horizontal axis by first listing year. Put the cohort count where readers can see it without hovering, especially on mobile.
Keep the incomplete latest year visually separate or omit it from a full-year comparison, as the chart here does. Do not stretch a short observation window to the full width of an annual bar and let the visual imply equal coverage.
If you convert the chart to annual units, convert every value consistently and update the axis and caption together. Preserve enough precision to reproduce the conversion while using rounded labels for readability. An unexplained format change can look like a new collapse.
Finally, keep the source date and the distinction between the public snapshot and a new web check visible. An article revised today can accurately explain older observations. It should not make those observations appear to be a newly measured current market. That is the difference between maintaining research and silently refreshing its apparent age.
Retain the source versions and calculation settings so a later reviewer can explain whether a changed result reflects data, method or labels.