
The two historical niche rankings differ. Finance has the highest page-RPM median among the rows shown, while food and drink has the highest recorded listing-multiple median. That is a comparison of two samples, not a rule for choosing a business model.
The published pairs
Swipe or scroll the table horizontally to see every column.
| Niche | Historical page RPM | Historical listing multiple | Listing records in that niche |
|---|---|---|---|
| Finance | $29.73 | 35x | 22 |
| Home & Garden | $25.43 | 36x | 51 |
| Culinary | $20.59 | 36x | 40 |
| Pet care | $18.97 | 40x | 46 |
| News & education | $18.13 | 29x | 35 |
| Food & drink | $17.93 | 42x | 28 |
| Technology | $15.51 | 30x | 54 |
| Entertainment | $8.41 | 26x | 23 |
| Information & databases | $8.41 | 41x | 18 |
| Hobbies | $7.07 | 38x | 27 |
| Gaming | $6.48 | 32x | 20 |
The RPM medians come from the 123-business earnings sample. The listing medians describe display-related sold-status records in the historical broker snapshot. The broader business-model download is not the same population as each niche row: it uses a precedence rule to assign records to business models.
Recompute with tied ranks
Spearman correlation ranks both columns and correlates the ranks. Equal values receive their average rank: the two $8.41 RPM rows tie, as do the two 36x listing-multiple rows.
Using those average ranks, the correlation of the eleven pairs is 0.073059, or about 0.073. The previous 0.036 value did not reproduce from this published table and has been removed. Download the eleven pairs to repeat the calculation without reconstructing values from prose.
A small observed correlation is not proof that the population relationship is zero. Eleven aggregated niches give little precision, and grouping can hide variation inside each niche. We do not attach a significance claim or use the result to rank future investments.
A comparison in money is still a scenario
At the same hypothetical $1,000 monthly profit, 35x implies a $35,000 listing benchmark and 42x implies $42,000. The $7,000 difference illustrates the multiples. It is not evidence that changing a site from finance to recipes produces a larger exit.
The underlying field is a listing multiple. A sold status does not independently verify the final amount a buyer paid. Our listing-versus-sale explanation sets out that distinction using the broker’s own report.
What a publisher can take from it
Keep income and valuation questions separate. For current income, use actual revenue and matching pageviews, then compare the resulting RPM with a clearly defined historical population. For an exit, inspect profits, workload, risk, reporting definitions and transaction terms; an RPM by itself cannot establish value.
The RPM tool uses the pooled historical distribution, and the display valuation tool uses pooled listing benchmarks. Neither provides a niche-specific percentile or a verified transaction appraisal. The business-model tool takes separately saved monthly net profit and compares its selected model’s listing multiples.
Correction, 19 October 2026: correlation, tie handling, source populations and price-field descriptions have been corrected. The earlier deterministic language about earnings predicting exits has been removed. Evidence grade: A: a small historical aggregate comparison, not a causal study or forecast.
Revenue efficiency and business price use different denominators
Page RPM divides advertising revenue by pageviews and scales the result to one thousand. Google's page-RPM definition makes that denominator explicit. It measures a revenue rate, not the profit left after operating the publication.
A price-to-profit multiple divides a stated price by a stated profit measure. It asks another question. A higher page RPM can improve revenue under fixed traffic, but costs, workload, risk, growth and the price field still matter to a valuation comparison.
Take a chosen example with fifty thousand pageviews and a $20 page RPM. Revenue is $1,000. If named monthly operating costs are $800, the remainder under that simple basis is $200. Another site with one hundred thousand pageviews at $10 page RPM also earns $1,000, but if its named costs are $300, its remainder is $700.
The same revenue and different page rates do not establish the same profit. These are illustrative cost scenarios, not measured sites. They explain why a rate ranking cannot replace the financial records needed for a price analysis.
What Spearman correlation describes here
Spearman correlation compares the order of values. In this table, it asks whether the niche groups that rank higher on historical page-RPM medians also rank higher on historical listing-multiple medians.
The R statistical documentation describes rank-based correlation and its handling through ranked inputs. The important implementation detail here is ties. Equal values receive the average of the positions they occupy before the rank vectors are correlated.
A coefficient near positive one would describe similar ordering in these paired group summaries. Near negative one would describe reversed ordering. The observed value near zero says the published eleven-pair table has little monotonic rank association by this calculation.
It does not say the two underlying business variables are independent. It does not rule out a nonlinear pattern, differences within groups or a relationship in another sample. It does not measure how much a particular site's price changes when its RPM changes.
Those boundaries are especially important with eleven aggregated pairs. A precise decimal output describes the calculation on the table; it does not imply a precise population estimate.
Ties are not an error to remove
Entertainment and Information share a displayed $8.41 RPM. Home & Garden and Culinary share a displayed 36-times multiple. Breaking those ties arbitrarily would give a different ranking based on row order rather than evidence.
Use average ranks for the equal values. Keep the displayed precision in mind: some ties may arise because the published summary is rounded. Without more precise source summaries, do not invent extra decimals simply to force a unique order.
The comparison can be reproduced from the downloadable eleven rows. Preserve those rows and the ranking rule together. If a future table changes a niche value or adds a group, report the new input set rather than claim the coefficient shifted under identical evidence.
The result here was independently recomputed during this editorial review from the published pairs. That checks the stated table arithmetic. It does not re-collect the underlying businesses or refresh their historical measurement dates.
Two group medians are not a matched business record
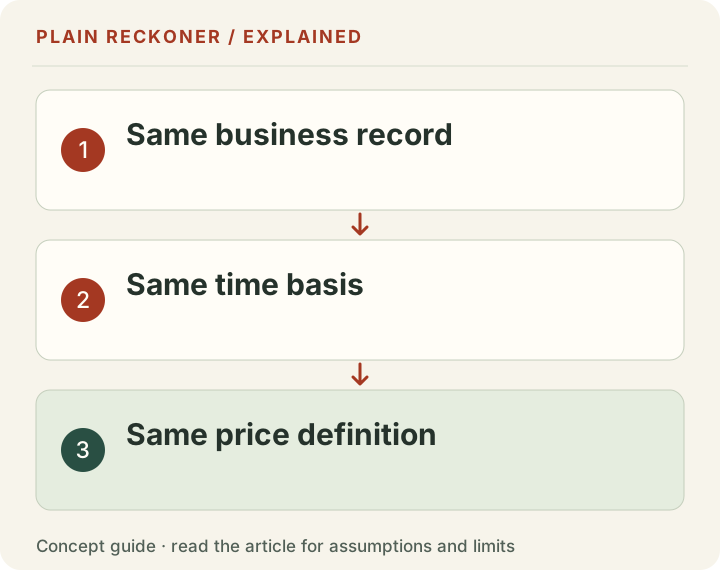
The RPM column and the multiple column summarize their respective historical cohorts. A niche pair does not mean one identifiable business had both median values at the same time.
That matters for interpretation. You cannot combine the median rate with the median multiple and call the product a measured niche exit. It is a scenario assembled from separate summaries, with the source populations and dates that implies.
Likewise, the number of listing records is not the RPM sample size for that niche. The earnings study has its own smaller subject counts. A broad listing category cannot lend its larger count to a narrow revenue-rate estimate.
Keep both source definitions visible. A professional chart should let readers identify the observational unit: here, one published niche pair. The calculation does not contain one row per individual business matched on revenue rate and verified closing consideration.
Aggregation can hide the pattern you care about
A group median discards much of the variation within a group. Two niches with the same median can have very different spreads, sizes or mixes. Eleven median pairs cannot recover those individual relationships.
For a chosen example, imagine a niche containing both small high-RPM sites and large lower-RPM sites. Its median might conceal the scale differences important to buyers. Another niche could have different operating costs or recurring revenue. The group label does not hold those factors constant.
This is not evidence that any particular hidden pattern exists in the saved sample. It explains why the aggregate result cannot settle a business-level causal claim. To study that question, you would need matched observations and a model appropriate to the actual data and assumptions.
More rows alone would not solve every problem. A larger selection from one marketplace can still differ from publishers that never list, private transactions or other business models. Sample size and representativeness are separate concerns.
Keep listing consideration separate from completed consideration
The historical multiple field is a listing multiple on records marked sold. The broker's API documentation distinguishes listing-related and sale-related fields. A status does not independently verify the final price paid.
The broker's own report separately publishes aggregate asking and sale metrics, as explained in the linked listing-versus-sale article. We do not apply a guessed discount to every row to make the dataset resemble a closing-price study.
For the same reason, a low correlation with listing multiples is not a verified low correlation with actual closed transaction values. That would require the relevant closing data. Preserve the field name instead of extending the conclusion beyond the source.
When considering a real transaction, inspect profit definitions, consideration terms, inventory treatment, fees and the financial period. The public historical table cannot substitute for diligence on the business being bought or sold.
Normalize monthly and annual units before comparison
The table's multiples are monthly-profit multiples. A 35-times monthly multiple is about 2.92 times annual profit under the corresponding twelve-month basis. A 42-times monthly multiple is 3.5 times annual profit.
Empire Flippers' September 2026 announcement changed how it displays multiples to annual units without changing listing prices. An old monthly screenshot and a current annual screenshot can therefore look radically different while describing equivalent ratios.
Converting every multiple by the same positive factor does not change their ranking. It would not change this rank correlation, provided the underlying values and precision are preserved. Rounding converted values can introduce ties, so keep sufficient source precision for reproduction.
The unit conversion does not fix a different profit basis. Revenue, SDE and EBITDA remain different measures. Do not use an annual conversion to disguise a numerator or denominator mismatch.
Use the finding to ask a better operating question
For a publisher seeking current income, begin with actual earned revenue, traffic and costs. If the rate changed, inspect matching periods and audience mix. If contribution changed, examine the named expenses as well.
For an owner considering a sale, start with reproducible financial records and the actual work required to operate the site. An attractive RPM can be one fact in that record, but it does not establish the price a buyer will offer.
For a buyer, examine the risks and assumptions that could change future contribution. A higher historical listing multiple is not proof of a safer asset. A lower multiple is not proof of a bargain. Both claims need more than a niche median.
The practical value of this comparison is to interrupt an unjustified shortcut: “high earnings per page means a high exit multiple.” The table does not support treating that as a reliable rule. It also does not support the opposite claim that revenue efficiency never matters.
A paired evidence checklist for a stronger future study
A more direct analysis would need business-level records with matching revenue, traffic, profit basis, relevant costs, dates and a clearly defined price event. It would also need enough coverage to examine model and selection limits.
Record missing fields rather than infer them from a category average. Keep one business's repeated periods distinguishable so they are not treated as independent businesses. Preserve exclusions and the treatment of ties and rounding.
Then choose the question before the statistic. Ranking association, prediction accuracy and causal effect require different designs and validation. A model that fits the existing records is not automatically accurate for a future transaction.
Until that evidence exists, the RPM tool and listing benchmark tool should remain separate views with their own assumptions. Use them to understand sensitivity and ask better questions, while keeping the limitations beside the result.
Separate a profit change from a multiple change
A chosen business with $1,000 monthly profit and a thirty-times monthly listing multiple has a $30,000 listing scenario. If profit rises to $1,200 while the multiple stays thirty, the scenario rises to $36,000. If profit stays $1,000 while the multiple rises to thirty-six, it also becomes $36,000.
The same $6,000 change can therefore arise from different assumptions. If both move, the effects multiply. At $1,200 and thirty-six times monthly profit, the scenario is $43,200. None of these calculations establishes what caused profit to change or what a buyer will pay.
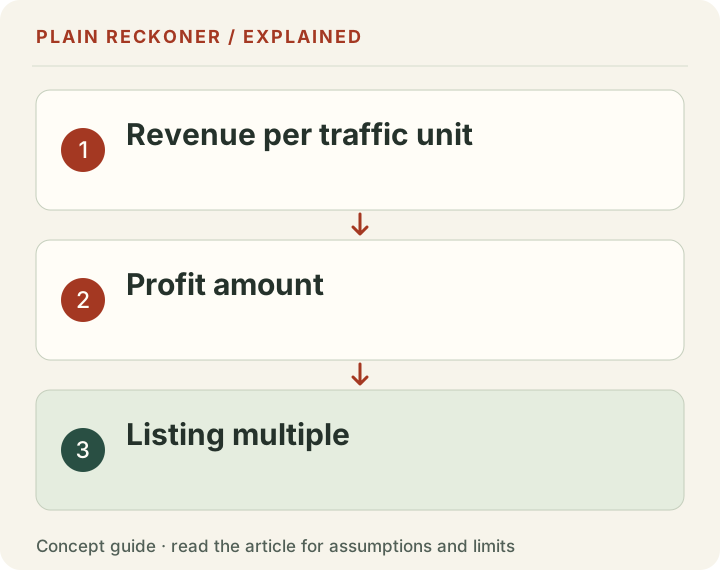
RPM is another step earlier in the chain. A rate can rise while traffic falls, leaving revenue flat. Revenue can rise while costs rise faster, leaving profit lower. A listing multiple can change while final transaction terms remain unknown. Keep each link explicit instead of jump from a better rate directly to a larger exit.
This is especially useful when discussing improvements with a team. An ad-layout change might target earnings per page. A publishing change might target useful traffic. An operating change might target cost or workload. A source-cleaning change might only improve the accuracy of the report. They need different outcome measures.
Choose the measure that matches the action, save the original assumptions and review the complete evidence afterward. The niche ranking is context for that conversation, not a substitute for it. A clear chain from traffic to revenue to named costs to a bounded price scenario makes the decision easier to challenge and improve.
No hidden prediction model sits behind this comparison: the published pairs, rank rule and stated limits are the complete analysis presented here.