
About 66,000 pageviews a month would generate $1,000 in monthly advertising revenue at the $15.21 median page RPM in our sample. That is roughly 2,200 pageviews a day in a 30-day month.
The useful answer is a range, though. At our lower RPM benchmark, the same income takes about 452,000 monthly pageviews. At the higher benchmark, it takes about 29,000. A traffic target without an earnings rate leaves out the part that changes the answer most.
We calculated those targets from the ad revenue and traffic of 123 display-only businesses whose numbers were checked by a broker before sale. Below are the calculation, the sample sizes by subject, and a way to replace our benchmark with your own figures.
These are gross ad revenue targets, before hosting, writers, software, taxes, or your own time. They are not a promise that a new site, or a site using AdSense, will earn these rates.

The quick answer: traffic for $100, $500, $1,000, and $3,000
Each column holds the earnings rate constant. The figures are monthly pageviews, rounded up; they are not visitors or sessions.
Swipe or scroll the table horizontally to see every column.
| Monthly ad revenue target | At $2.21 page RPM: low benchmark | At $15.21: sample median | At $35.05: high benchmark |
|---|---|---|---|
| $100 | 45,249 | 6,575 | 2,854 |
| $500 | 226,245 | 32,874 | 14,266 |
| $1,000 | 452,489 | 65,747 | 28,531 |
| $3,000 | 1,357,467 | 197,239 | 85,593 |
The low and high benchmarks are the tenth and ninetieth percentiles of the measured RPM distribution. They describe the spread in this sample. They are not a confidence interval for your website, and the table does not say that growing traffic leaves your RPM unchanged.
If you need a working plan before you have an earnings history, keep all three scenarios. A budget that only works in the high-RPM column depends on achieving an unusually strong rate within this particular sample.
The formula, and the denominator that matters
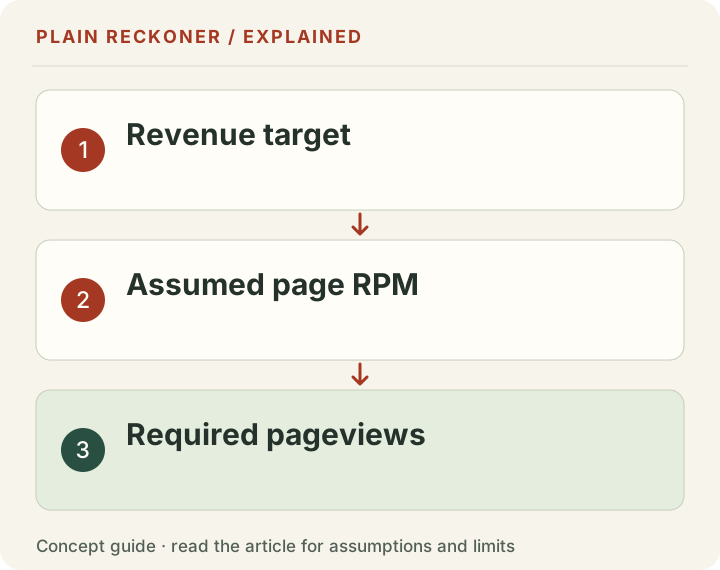
Google defines page RPM as estimated earnings divided by pageviews, multiplied by 1,000. Rearranging it gives:
Monthly pageviews needed = monthly ad revenue target × 1,000 ÷ page RPMFor the $1,000 target at the measured median:
$1,000 × 1,000 ÷ $15.21 = 65,746.22 pageviews
Round up: 65,747 pageviews a month
The precision shows the calculation, not the certainty of the forecast. For planning, call it about 66,000.
Make sure your RPM uses the same denominator. An ad network can report revenue per thousand sessions or revenue per thousand ad impressions. Neither can be inserted into a pageview formula unchanged. One page can contain several ad impressions, and one session can contain several pageviews. There is no universal conversion factor.
If you already earn from ads, use the ad revenue and pageviews for the same reporting period. Mixing this month's revenue with last month's traffic produces a rate that never actually occurred.
The traffic target changes by subject
Here is the $1,000 monthly target using the median page RPM for each subject we publish. We show the number of sampled businesses beside every rate because a median based on three sites deserves less confidence than a large representative study.
Swipe or scroll the table horizontally to see every column.
| Subject | Sampled sites | Median page RPM | Monthly pageviews for $1,000 |
|---|---|---|---|
| Finance | 3 | $29.73 | 33,637 |
| Home & Garden | 9 | $25.43 | 39,324 |
| Culinary | 11 | $20.59 | 48,568 |
| Pet Care | 5 | $18.97 | 52,715 |
| News & Education | 9 | $18.13 | 55,158 |
| Food & Beverages | 6 | $17.93 | 55,773 |
| Technology | 8 | $15.51 | 64,475 |
| Information / database | 8 | $8.41 | 118,907 |
| Entertainment | 7 | $8.41 | 118,907 |
| Religion & Spirituality | 4 | $8.07 | 123,916 |
| Hobbies | 4 | $7.07 | 141,443 |
| Gaming | 13 | $6.48 | 154,321 |

Only subjects with at least three sampled businesses appear. The categories come from the broker's records; Culinary and Food & Beverages remain separate rather than being combined after looking at the results.
The finance and gaming scenarios are about 4.6 times apart. That is a difference between observed groups, not evidence that changing your subject causes your earnings to multiply. Geography, ad setup, audience, season, and the businesses selected for sale can all differ between groups.
Choose the closest subject for a scenario, then replace it with your own measured RPM as soon as you can. Do not change a working site's subject because a three-site category leads a table.
Can 50,000 pageviews make $1,000 a month?
Yes, if the site's page RPM is at least $20:
$1,000 ÷ 50,000 × 1,000 = $20 page RPMOf the 123 businesses in our downloadable sample, 44 had measured RPM of at least $20. That establishes that the rate occurred in these records. It does not mean a new publisher has a 44-in-123 chance of reaching it: businesses that sold through a broker are a selected population.
At the sample median, 50,000 monthly pageviews produce $760.50 in ad revenue. At 100,000, the same rate produces $1,521. These are calculations at a constant rate, not a growth forecast.
If you already get 50,000 pageviews and earn $300, your page RPM is $6. Reaching $1,000 at that rate takes about 166,667 pageviews. The immediate question is whether your rate can realistically improve, whether more traffic can earn the same rate, or whether another income source better suits the audience. This dataset alone cannot answer those questions for you.
Revenue is not take-home income
If your goal is $1,000 left after $100 of monthly operating costs, the ad revenue target is $1,100. At $15.21 page RPM that takes about 72,321 pageviews, before tax or any payment for your time.
Write down the actual costs you need the site to cover. A publisher who writes everything personally and a publisher who pays contributors have different income targets even if their traffic and RPM match.
Affiliate commissions, subscriptions, products, and sponsorship are separate revenue streams. They can reduce the amount you need from display ads, but this sample does not estimate what those streams would earn for your site. Count money you have evidence for rather than adding hypothetical income to make the plan work.
Where these rates came from
The source is our RPM measurement from broker-verified website sales, not a survey asking publishers to remember their earnings. The sample contains 123 businesses earning from display advertising alone, with traffic and revenue matched month by month across 1,334 business-months.
The underlying records were measured in August 2026. This article adds a new traffic-target calculation on 19 October 2026; it does not present the old records as a fresh October sample.
You can download the 123-row RPM dataset and inspect each business's subject, measured RPM, months, pageviews, revenue, and listing year. Individual business RPMs in that public file are rounded to cents. The traffic scenarios here use the published, also rounded benchmark rates.
There are four important limits:
- Sale selection: these are businesses that reached a broker's sold archive, not a random sample of websites or beginners.
- Network attribution: the records do not establish that each business used AdSense, Mediavine, or another specific network. Calling these “AdSense RPMs” would be wrong.
- Timing: the businesses span different listing years. A historical distribution is not a measurement of today's advertising auction.
- Small groups: some subject medians rest on very few sites. The exact pageview calculation does not make those rates precise estimates of your future.
We excluded listings from 2014–2016 from the underlying RPM measurement because their pageview figures produced an implausible distribution. The original methods article explains that choice. Our new calculation adds no businesses and makes no new network eligibility claims.
Work out the target for your own site
Use this sequence before deciding that you need more traffic:
- Take your pageviews and display ad revenue for the same month. Keep affiliate and product income separate.
- Calculate page RPM: ad revenue divided by pageviews, multiplied by 1,000.
- Add the costs you need to cover to your desired income.
- Divide that revenue target by your RPM and multiply by 1,000.
- Repeat with other months you actually observed. A strong month alone is a fragile budget.
The free RPM comparison tool puts your current rate against the measured distribution. The revenue calculator shows scenarios by subject. Both work without an account; the figures you enter are calculated in your browser.
If you are still waiting for ad approval, start with the requirements Google actually publishes. A traffic calculation does not replace approval, network eligibility, or a useful site people choose to read.
A traffic spike can move the target farther away
The traffic target formula holds the earnings rate constant. Growing a site does not promise that constant rate. More pageviews can come from countries, devices, pages or visitor sources that earn differently from your earlier audience.
Mediavine's explanation of RPM during a traffic spike makes audience mix one of the checks. That is provider guidance about possible explanations, not proof that the same explanation applies to your site. Start by observing both total money and the matching traffic measure.
Consider a separate chosen example. A site has 50,000 monthly pageviews and earns $500, giving a $10 page RPM. It then adds 50,000 pageviews from a new group earning $2 per thousand. If the original audience still earns $500, the new group adds $100. The total becomes 100,000 pageviews and $600, or a blended $6 page RPM.
Traffic doubled. Revenue rose twenty percent. The lower blended RPM does not mean the original audience earned less, and the additional traffic did not reduce total revenue in this example. But applying the original $10 rate to all 100,000 pageviews would have overstated revenue by $400.
This is why “double traffic to double income” needs a condition: the added traffic must generate the same average revenue rate, and other relevant conditions must remain comparable. Measure the added audience rather than infer its value from an earlier average.
Build a planning range from complete months
If you have several months of history, calculate each month's rate using matched revenue and pageviews. Keep a note of network changes, incomplete reporting periods, major traffic events and unusual costs. Do not silently drop weak months just because they make the target look harder.
For a combined rate, divide total revenue across the selected months by total pageviews, then multiply by one thousand. That is a pageview-weighted rate. Simply averaging monthly RPMs gives each month equal weight even when traffic differs sharply.
Suppose one complete month has 10,000 pageviews and $200 revenue, a $20 page RPM. Another has 90,000 pageviews and $450, a $5 page RPM. The unweighted average of the two rates is $12.50. But the combined result is $650 from 100,000 pageviews, a $6.50 page RPM. Using $12.50 to plan that combined traffic population would give a misleadingly low target.
Neither calculation is universally forbidden. An equal-month average can describe the typical month in a defined period. The pooled rate describes revenue per pageview across that period. Label the question before choosing the measure. For a traffic-to-revenue scenario, the pooled rate usually makes the volume weighting easier to inspect.
Check missing earnings before chasing more visitors
A sudden revenue shortfall deserves a measurement check before a publishing sprint. Google's earnings troubleshooting guide separates pageviews, ad coverage and ad impressions as parts of the investigation. These measures are related, but they are not interchangeable.
Confirm that the pageview count and earnings cover the same site, dates and timezone. Check whether the ad code or consent behavior changed. Look for large gaps between ad requests and matched requests, but do not interpret coverage alone as a full diagnosis. Some visits may not produce an ad request at all.
Then inspect country, device, page and traffic-source changes where your reports support them. A broken ad implementation calls for a technical fix. A different audience mix calls for a different revenue scenario. A genuine demand decline may require a more conservative plan. The same low RPM does not identify which problem occurred.
Avoid adding more ad slots purely to make the table's target look attainable. More slots do not guarantee proportional revenue and can harm the experience readers came for. A useful publishing business needs people to return, navigate and trust what they read, not merely produce a larger impression counter.
Turn a revenue goal into a decision you can review
Write the goal in a form another person can check: monthly gross ad revenue target, operating costs, traffic unit, rate source and date range. State what is excluded. A goal for revenue is different from a goal for owner income, and neither is automatically a cash-payment schedule.
Choose a review date after complete reporting is available. Compare actual revenue and traffic with the scenario, then explain which input changed. Keep the old scenario rather than replacing it silently. That lets you learn whether the planning error came from traffic volume, earnings rate, cost assumptions or a mixture.
Finally, choose the next action based on the evidence. If people already use your useful pages but monetization is broken, fix that setup. If earnings rates are stable but demand is limited, investigate the questions your audience still cannot answer. A precise pageview target helps you size the gap; it does not by itself tell you which content to create.
Save the source exports with that review. A screenshot of an RPM headline cannot establish which pages, dates or revenue streams were included, making later comparisons harder to reproduce.