
Two websites with different RPMs do not establish the effect of page format. The audience, niche, country mix, reporting period and advertising setup can differ as well.
The historical comparison behind this note included a calculator business reported at $12.72 page RPM and a stove-related site reported at $43.29. Those figures describe the two businesses in the observations. They are not the expected earnings of all tools and all articles.
The earlier version also described calculator pages as having room for one or two in-content ads and long articles as having room for six to twelve. Even if those counts describe the inspected pages, the observation is not a universal ceiling. Layout, ad formats, policy limits, user experience and the work a page does all matter.
A denominator difference is not a bidding premium
Session RPM can exceed page RPM because a session may contain more than one pageview. At the same revenue, the ratio between the two RPM measures follows from the traffic denominators. It does not by itself establish that advertisers bid more for a first page or that a tool loses a fixed 20–25% premium.
We removed that numerical penalty from this article. The matched session/page example shows the arithmetic without inferring an auction effect.
More ad slots do not guarantee more useful revenue
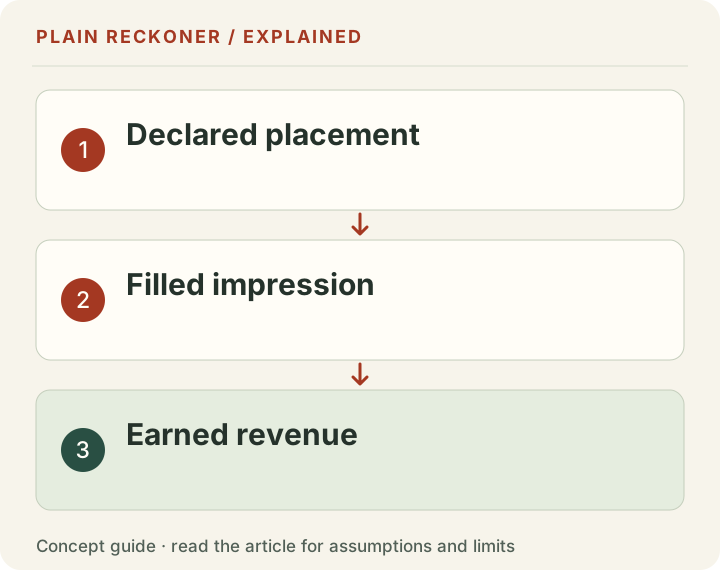
An extra slot is not automatically a viewable, filled or valuable impression. Additional placements can also affect readability and interaction. A short useful tool should not be padded with unrelated text simply to create places for ads.
A publisher evaluating a layout needs complete-period revenue, pageviews, impression and viewability definitions, audience composition and reader-experience measures. Where possible, compare the same site under controlled conditions. Unmatched business examples cannot isolate the effect of changing format.
What a tool page should explain
Make the inputs and their units clear. Show whether results use user-provided data, historical benchmarks or hypothetical assumptions. Explain limitations beside the output and link to the underlying method. A useful worked example can help a reader understand the tool; adding unrelated words does not prove value.
Our RPM tool calculates a page RPM from matching revenue and pageviews and compares it with a historical site sample. It cannot establish what a page format would earn under a different network or layout. The income calculation is also a scenario, not a revenue forecast.
What would make this a format study
Define formats before collecting outcomes. Include enough sites to examine within-format variation, keep traffic and revenue windows matched, and record the factors that could explain differences. A controlled layout change within a site could answer a narrower question more convincingly than comparing unrelated businesses.
The sampling-frame note explains why a convenient collection of examples can mislead. For approval questions, use current AdSense guidance rather than assuming that a tool must become a long article.
Correction, 19 October 2026: universal slot ceilings, a fixed session premium, a format-wide revenue penalty and claims about how defensible calculator sites are have been removed. Evidence grade: C: historical observations that motivate better measurement, not a controlled comparison.
Start with the revenue identity
Google defines page RPM using revenue divided by pageviews, multiplied by 1,000. Its impression RPM uses ad impressions instead. That difference provides a useful way to organize a format comparison without claiming that slot count determines earnings.
With matching revenue and reporting scope, page RPM equals impression RPM multiplied by ad impressions per pageview. This is an accounting relationship between the recorded totals. It does not explain why either component changed, and it works only when the inputs cover the same period and inventory.
Use chosen inputs to see the relationship. Suppose a page group records 10,000 pageviews, 20,000 ad impressions and $100 in revenue. Its page RPM is $10, its impression RPM is $5 and its impressions per pageview are two. Multiplying $5 by two gives the $10 page RPM.
Now suppose another group has six impressions per pageview but only $1 impression RPM. Its page RPM would be $6. More impressions per page do not guarantee more revenue per page. These demonstration inputs do not describe the two historical businesses or establish a typical value for either format.
A placement is not the same thing as a recorded impression
Counting boxes in a page layout is a useful implementation observation. It does not establish how many ad requests were made, how many were filled, whether an ad loaded or how the provider counted the resulting impression.
A placement below the point where most readers leave may behave differently from one near a tool result. Lazy loading can affect when a request occurs. Screen size can change which placements are eligible. The relevant reporting definitions need to come from the particular provider rather than a guess based on a screenshot.
Even a measured impression count is not a direct count of attentive readers. Keep viewability, interaction and completed tasks separate. A publisher can create more recorded ad activity while making the tool less useful to the person who came to calculate something.
That is why this article no longer converts one or two visible slots versus six or twelve into a universal revenue ratio. The visual counts were not a controlled experiment, and a slot count is only one step in the chain.
Use the reader's task to decide what belongs on the page
A calculator page should make its inputs, answer and next step easy to find. If a user needs a definition or a worked example to interpret the output, that explanation is part of the product. If a paragraph exists only to push the result lower and create another ad position, it may work against the task.
Consider a page that calculates a free-shipping threshold. Useful supporting content explains what counts as contribution, how shipping cost enters the calculation and why returns can change the result. Repeating a generic history of online shopping does not help the user choose an input.
A long article has a different reading path. Its sections may contain evidence and arguments that need space. That can create a different advertising layout, but the content should earn its length by helping the reader. Neither short tools nor long articles deserve an automatic quality label based on format alone.
When evaluating a page change, ask whether a first-time visitor can still complete the task on a small screen. Advertising should not cover the controls, look like a required input or make the answer harder to distinguish from a promotion.
Check policy and experience separately from revenue
Google's policy on screens without publisher content addresses absent or low-value content, unfinished screens and behavioral screens such as navigation or alerts. It does not establish a blanket ban on calculators. The actual page and placement need to meet the applicable policies.
A working formula alone is not a guarantee of approval, just as a long article is not a guarantee. The tool's usefulness, content, navigation and implementation all matter. Do not turn this historical earnings comparison into an AdSense acceptance rule.
The Better Ads Standards identify problematic experiences and distinguish desktop, mobile and other contexts. They should not be reduced to one universal percentage applied to every screen. Inspect the relevant format and experience rather than repeating a density number without its conditions.
Passing one check also does not establish the others. A policy-compliant placement may still be commercially weak. A higher-earning placement may still be frustrating. A responsible review measures the revenue question and the user-experience question together.
Build a page-group comparison before making a site-wide change
Begin with groups whose definitions are stable. Separate tool pages from articles using a documented rule, and record pages that combine both. Do not move an underperforming page into a different category simply because its result is inconvenient.
Match the date window, timezone, currency and traffic measure. Keep estimated earnings separate from finalized earnings. Check whether the revenue report covers the same pages as the traffic report, especially if the provider uses its own pageview definitions.
Then inspect the audience mix. A calculator serving a different country or device mix from an article group can have a different revenue pattern for reasons unrelated to layout. These factors do not make comparison impossible, but they limit what the totals can isolate.
Report the total revenue and total pageviews beside the RPM. A group with 500 pageviews and a few high-value events can produce an unstable rate. A neat chart should not hide the amount of evidence behind each point.
Do not average page RPMs without weights
Suppose a chosen example has two pages. Page A earns $10 from 1,000 views, giving $10 RPM. Page B earns $10 from 100 views, giving $100 RPM. The simple average of the two rates is $55, but the group's total is $20 from 1,100 views, or about $18.18 RPM.
Both calculations can be described mathematically, but they answer different questions. An equally weighted page average treats each page as one observation. The pooled rate describes earnings per thousand pageviews across the group.
If the decision concerns the total revenue effect of changing the group, use totals or the appropriate pageview weights. If the decision concerns the distribution of page performance, show a distribution with its unit clearly stated. Do not call a median page rate the earnings rate for all traffic combined.
The same issue appears in our historical business research. A median business RPM and a pooled pageview-weighted RPM need not match. Neither is automatically wrong; the mistake is using one label for both or switching measures during a comparison.
A controlled layout test answers a narrower question
A careful test within one site can be more informative than comparing unrelated businesses. Define the proposed change, the target page group, the primary outcome and the experience safeguards before collecting results.
Keep other important changes stable where practical. A simultaneous redesign, traffic campaign and network migration makes attribution harder. If a provider supports a properly assigned experiment, use its documented method and review how visitors or pageviews are allocated.
Measure revenue alongside task completion, loading behavior and mobile usability. Decide in advance what degree of harm would stop the test. Do not keep a broken input or obscured answer live merely because a revenue ratio looks promising.
If the comparison is simply before and after, label it as such. Seasonal ad demand, changing traffic and report adjustments can affect the result. A before-and-after difference is useful evidence to investigate, but does not isolate the placement's causal effect as cleanly as a suitable controlled design.
Preserve low-traffic and zero-revenue cases
Do not omit pages merely because they earned nothing. Excluding zeros can make a format appear stronger than it was. Keep failures to load reporting, missing revenue and a confirmed zero as different states.
Likewise, a page with no views has no meaningful page RPM for that period. Display an unavailable rate rather than dividing by zero or substituting an impressive default. A calculator used for evaluation should handle these states explicitly.
Large positive rates also deserve inspection. They may reflect a small denominator, delayed reporting, a different period or a genuine unusual outcome. Investigate before presenting them as a repeatable opportunity.
These are simple checks, but they are essential when a format comparison is used to justify a business model. A dataset that silently drops the difficult cases can tell an attractive story while answering the wrong question.
Decide what the evidence is strong enough to change
If a page group's revenue is lower, first determine which component differs: traffic, impressions per page, impression earnings or the reporting scope. Then identify a change the publisher can actually test. The appropriate response might be better audience matching or a clearer tool, rather than more placements.
If a tool creates value without many ads, there may be other ways to support it, but this study does not establish their commercial success. Avoid replacing one unsupported format claim with another claim about sponsorships, subscriptions or lead capture. Each needs its own audience and business evidence.
For a visitor using a free calculator, the important standard is direct: the inputs should be understandable, the arithmetic should be reliable and the result should explain its limits. The surrounding content should help the visitor apply that result.
For the publisher, the next step is equally practical. Build a matched page-group report, review a few actual mobile sessions or usability tasks, and test a specific improvement with safeguards. Do not use two historical business RPMs as a reason to abandon a useful tool or to fill it with unrelated text. The evidence supports a better measurement question, not a verdict on an entire format.
Save a review record with the result
A useful review record includes the page-group rule, reporting dates, traffic source, revenue status and any changed placements. Save the input totals as well as the final rate, so another reviewer can reproduce the arithmetic without trusting a screenshot.
Record known limitations in the same document. If country mix was unavailable, say so. If a provider changed its reporting definition during the window, split or qualify the comparison. Those notes explain what would need to be collected next. They make the result more actionable than a single format ranking detached from its assumptions.