
This historical sample has a median business-level page RPM of $15.21, with a wide spread between businesses. Page RPM describes advertising revenue per thousand pageviews. Other RPMs can use sessions or ad impressions, so keep the denominator explicit.
The purpose is a reproducible reference for the records we could inspect, not a ranking of ad networks or a claim to have surveyed every rate table online. Google's page-RPM definition supplies the formula; the historical business records supply the inputs.
So we worked it out. Empire Flippers is a broker: it sells websites, and it checks both traffic and revenue before a listing goes up. Take only the businesses that earn from display advertising and nothing else, and the revenue the broker checked is advertising revenue. Both figures are available month by month.
The sample: 123 businesses · 1,334 business-months · 1,174,949,344 pageviews · $6,844,447 of revenue.
Here is the spread. Read it as: a tenth of these sites earn less than $2.21, a quarter earn less than $6.88, half earn less than $15.21, and so on up.
| RPM | |
|---|---|
| bottom tenth | $2.21 |
| bottom quarter | $6.88 |
| middle | $15.21 |
| top quarter starts at | $25.16 |
| top tenth starts at | $35.05 |
And by subject. The middle site in each, with the number of sites it is the middle of:
| Subject | sites | middle |
|---|---|---|
| Finance | 3 | $29.73 |
| Home | 9 | $25.43 |
| Culinary | 11 | $20.59 |
| Pet Care | 5 | $18.97 |
| News & Education | 9 | $18.13 |
| Food & Beverages | 6 | $17.93 |
| Technology | 8 | $15.51 |
| Information | 8 | $8.41 |
| Entertainment | 7 | $8.41 |
| Religion & Spirituality | 4 | $8.07 |
| Hobbies | 4 | $7.07 |
| Gaming | 13 | $6.48 |
Two things worth pulling out.
Pooled RPM and the median business answer different questions. Dividing the published $6,844,447 by 1,174,949,344 pageviews and multiplying by 1,000 gives $5.83, not the $11.62 previously printed here. The $15.21 figure is the median of business-level median monthly RPMs. A weighted aggregate can differ substantially; that alone does not establish a general relationship between site size and RPM.
The sampled Information group has a lower median than several other published groups. Its $8.41 does not establish the earnings of every database or directory. The group contains eight businesses, with its own audience and selection limits.
Do not build a budget from a standout site's rate
A public case study can accurately describe one publisher without representing the middle of its subject. Before borrowing a rate, check its denominator, dates, geography, revenue scope and sample size. A named success story and a historical median answer different questions.
For an explicitly chosen $5,000 annual ad revenue scenario, the monthly target is $416.67. At the overall $15.21 page RPM, that requires about 27,395 monthly pageviews when rounded up from the exact annual target. At the sampled Home group's $25.43, it requires about 16,385. These are rate-held-constant calculations, not provider approval predictions or causal niche effects.
How the table is produced
scripts/measure-rpm.mjs walks through the marketplace's own data, keeps only sold listings funded by display advertising alone, matches each month's revenue to that month's pageviews and works out the middle values — so anyone can run it again and get this table, or a different one and know exactly why.
It has been run twice, over samples of different sizes, most recently across 123 businesses. Every subject moved slightly between runs and the ORDER did not change at all: Finance above Home above Culinary above Technology above Information above Gaming, both times. Agreement between overlapping runs is a stability check on this source and method. It is not an independent replication or proof the same order holds in the wider publisher population.
The middle blends nine years, and that matters
$15.21 is the median of the business-level median monthly RPMs, using historical records from 2017 onward. It is not the median of every pooled business-month or a forecast for a particular operating year. Split by the calendar year each month falls in, the same 123 businesses look like this:
| Year | businesses | Middle RPM |
|---|---|---|
| 2017 | 23 | $6.76 |
| 2018 | 24 | $4.35 |
| 2019 | 18 | $11.46 |
| 2020 | 23 | $15.40 |
| 2021 | 27 | $16.17 |
| 2022 | 29 | $21.08 |
| 2023 | 15 | $20.92 |
| 2024 | 11 | $23.15 |
| 2025 | 6 | $26.58 |
Anyone planning a 2026 site against $15.21 is using a historical median that includes 2018. The recent years sit near $21–27.
The cross-year group pattern and paired-business pattern differ. Follow the selected businesses across two consecutive years and the later-to-earlier RPM ratio has a lower median: the middle year-on-year ratio is 0.923 across 55 pairs. It is below 1 however we cut it — 0.910 over 92 pairs when we require one month per year, 0.806 over 3 pairs when we require six.
Both facts are real and they point in opposite directions. The cross-sectional mix and paired-business comparisons answer different questions; the selected paired observations had a lower median RPM in the later year; this is not a general forecast for every individual site. Quoting the first without the second would be exactly the error this page corrects elsewhere.
Run it yourself: node --experimental-strip-types scripts/measure-rpm.mjs --vintage
The spread is worked out from every business, not from the subject middles. Working from the subject middles throws away the variation inside each subject and then reports what is left as the variation across the market, which understates it badly. Measured across all 123 businesses, the range from the bottom tenth to the top tenth is $2.21 to $35.05 — a 15.8× range. That is the number that matters here: quoting any single RPM against a spread that wide tells a publisher almost nothing about their own site.
Three subjects gained enough businesses to publish, and two lost them. Pet Care, News & Education, Entertainment, Religion & Spirituality and Hobbies now have at least 3 sites each. Health & Fitness and Lifestyle fell to 2 and have been withdrawn — our publication rule does not show a niche median below three businesses. Three is still a very small sample, not a statistical guarantee.
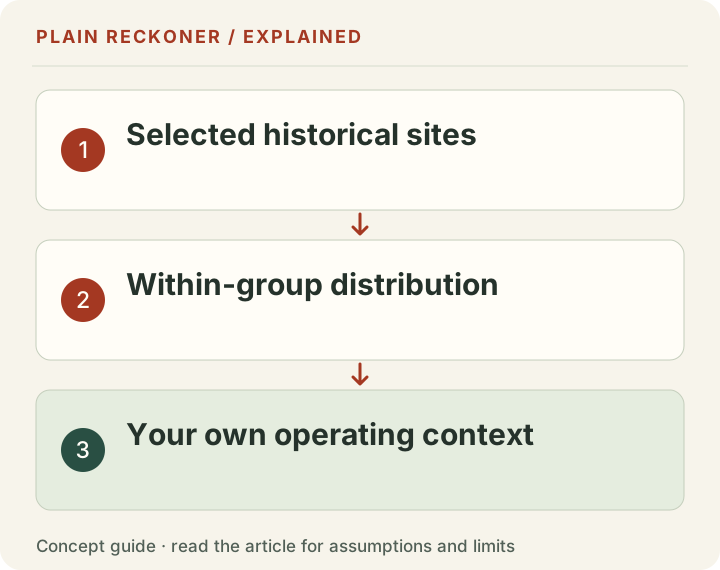
This is a primary-data benchmark (grade A), not a representative market estimate. The method can be re-run and the inputs were checked by a broker, but each subject rests on between 3 and 13 sites, and these are snapshots taken at the moment of sale between 2017 and 2026 rather than a picture of the market today.
Put your own numbers in
These are the figures behind our ad revenue calculator — pick your subject, enter your monthly pageviews, and it returns the range this table implies rather than a number invented for the page.
It reports how many sites are behind each subject, because a middle over 3 sales is not the same claim as a middle over 13, and a calculator that hides that is worse than no calculator.
Correction, 19 October 2026: pooled arithmetic and the median’s unit have been corrected. Tool range scenarios scale the pooled spread to a niche median; they are not independently measured within-niche quartiles or forecast intervals. Collection remains historical, and no network-specific RPM promise is made.
Why the pooled rate differs from the middle business
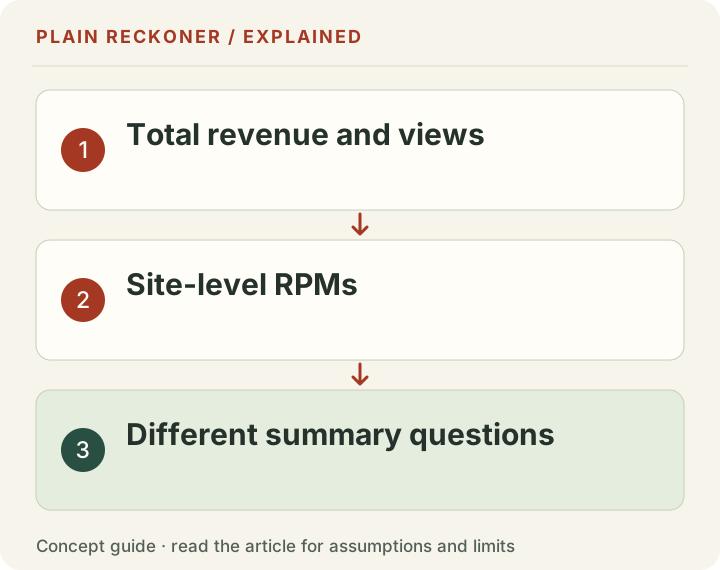
The pooled rate weights the pageviews that generated each dollar. The median business rate gives each business one position after its own monthly rates have been summarized. Neither is automatically wrong when they differ.
Take a separate chosen example with three businesses. Two small sites each have 10,000 pageviews and $200 revenue, giving $20 page RPM. A larger site has 980,000 pageviews and $2,940, giving $3 page RPM. The median business rate is $20 because two of the three sites have that rate.
Together they have one million pageviews and $3,340 revenue. The pooled page RPM is $3.34. Most pageviews came from the lower-rate business. That explains the arithmetic difference without proving a universal rule that larger sites earn less per page.
NIST's explanation of location measures distinguishes a mean from a median. Here the extra issue is the unit being summarized: a pageview-weighted pool, an equally weighted set of business summaries or an equally weighted set of months. Name both the statistic and its observational unit.
Our published $15.21 uses the business-summary unit. The $5.83 pooled calculation uses the published total revenue and traffic. A reader should be able to see which one an earnings scenario uses rather than discover the distinction after comparing two outputs.
A niche label is not an intervention
Finance has the highest median among the groups shown here, but only three businesses support that figure. It does not tell a gardening publisher what would happen after switching to finance content. The groups can differ in countries, page types, audience needs, traffic sources, years and ad setups.
A subject is also not a substitute for demand or expertise. A site cannot simply adopt a profitable-looking label and inherit the measured audience. Changing direction can lose existing readers while entering a field where it has less useful information to offer.
Use the niche table to ask a narrower question: “How does my matched page RPM compare with this historical group, and what differences could explain it?” Then inspect your own reports. If your traffic comes from different countries or a different period, the comparison needs that context.
A tiny niche sample should widen caution, not narrow a forecast range. The table's exact cents are needed for reproduction, but they do not establish that the population median is known to the cent. The distribution describes selected observations, not a promise about the next business.
Sold-status records do not establish a closing price
The Empire Flippers marketplace is the source family for the business records. The RPM calculation uses reported revenue and traffic in the selected historical listings. It does not require us to treat a displayed asking price as a verified amount paid by a buyer.
Keep those evidence types separate when reusing the data. A record's sold status, the broker's input checks and a verified final transaction price are different claims. The RPM study is not independent auditing of every seller's accounts or a record of final settlement amounts.
Likewise, the single-broker frame leaves out many publishers: sites never offered for sale, businesses below the broker's admission criteria, private transactions and other marketplaces. It may select for particular ages, sizes or operating styles. A precise median inside the frame does not make the frame representative.
Reproduce the part relevant to your decision
Begin with your own matched period. Divide display ad revenue by pageviews and multiply by one thousand. Exclude unrelated affiliate or product revenue if you want a comparable display rate. Keep estimated and finalized revenue labeled rather than silently combine them.
Then choose the comparison scope: overall historical distribution or a published niche subset. Read the row count and vintage. Use the dataset and field definitions to see what is actually available. The public business-level figures are rounded, so small reproduction differences can result from rounding before a later calculation.
Do not infer missing network membership from the rate. These records do not establish a current AdSense, Journey or Raptive benchmark. Network-specific advice needs the relevant provider reports or appropriately comparable data.
Finally, test how much the decision depends on the chosen rate. If a spending plan works only at the highest published niche median, show a lower-rate scenario. If actual earnings differ, investigate traffic mix, setup and reporting first rather than assume the benchmark proves your site is broken. Compare your figures with the definitions beside the result.
What a percentile can and cannot tell you
A percentile locates a value within a specified observed distribution. It does not measure the quality of the business, the effort of its owner or the chance of future success. A site below the historical median may have a useful audience, different revenue streams or a deliberate lower-ad-load policy.
For that reason, do not read “above half the sample” as “better than half of publishers.” The comparison covers the selected business RPM values only. It also needs a real distribution calculation; a linear position between the tenth and ninetieth percentile endpoints is not a percentile rank.
If your result is close to a published boundary, avoid overinterpreting the exact rank. Rounding, ties and small samples can affect the displayed position. A difference of a few cents need not justify changing an ad setup. Look for an economically meaningful gap supported by matching definitions and enough observed history.
Keep the research history traceable
The pooled-rate correction is part of the research record. Keeping the correction note tells readers which statement changed and why. Quietly replacing the number without explanation would make old shared copies harder to reconcile.
The same approach applies to future additions. A new source, a changed exclusion rule or a larger sample can alter the median. Publish the new method and cohort beside the updated result, retaining enough version information for someone to understand the difference.
A repeated measurement can improve this benchmark over time without making every earlier result meaningless. What matters is the question each version answered, the observations it used and the limits it disclosed. That source-and-method trail is more durable than presenting one historical number as the permanent earnings rate for a niche.
Keep the original source-period label when sharing a chart so readers do not confuse a new illustration with a new measurement.