
Before trusting a percentage, ask what allowed each business into the list. If the list was assembled by searching for published monthly rates, it is poorly suited to estimating how often businesses publish monthly rates. The selection already favors the outcome being measured.
An alternative list can reduce that particular problem without becoming representative automatically. Our historical exploratory probe used mapped businesses with website information. It recorded 28 monthly-price observations among 42 scored websites. That is a result about the scored group under the old method, not a current rate for every business in the market.
This guide explains how to inspect the frame, keep unknown cases visible and turn a plausible pattern into a bounded statement. The same checks apply to publisher studies, store comparisons and reader-feedback recruitment.
Define the population before choosing a convenient list
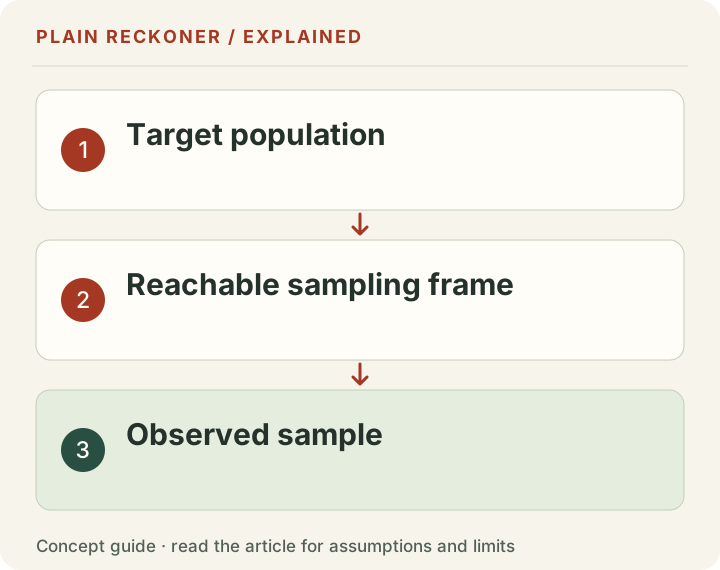
The population is the group the question concerns. It might be all operating businesses of a defined type in a region on a stated date. The sampling frame is the list from which observations can actually be selected. Those two groups often differ.
A directory may omit unregistered businesses or retain closed ones. A map may have uneven geographic coverage. A seller marketplace includes businesses offered for sale under its own admission rules. None becomes a complete business population merely because it contains many rows.
Write the intended population in a sentence that can be checked. Define geography, business type, time and the unit being counted. A location, company, domain and booking unit are different entities. A chain with ten locations should not silently become one observation in one part of the report and ten in another.
Then describe how the frame relates to that population. The gap belongs in the method, not only in a footnote added after a strong market-wide headline has already been written.
Search results are evidence about discoverable pages
Search can be useful for discovering competitors, examples and terminology. It can also help identify sources that may answer a question. The problem is treating the returned pages as if they were a probability sample of all businesses.
A query containing a rate term can favor businesses whose pages contain or are associated with that term. Ranking and coverage mechanisms introduce further selection. The exact bias is not a guaranteed near-100% result; it depends on the query and results. The method is simply not designed to estimate a general publication share.
A precise description might be that a certain number of inspected search results contained a relevant price. That can answer a discoverability question for the recorded query and context. It does not answer how many businesses publish a price across the whole market.
Do not throw away search research because it cannot answer everything. Match the claim to the method. A competitor discovery sample and a publication-prevalence study can both be useful when their purposes remain distinct.
A map frame removes one filter and adds others
The historical probe used OpenStreetMap information rather than a price-related query to assemble its list. That avoids selecting pages directly because a price term was found. It does not establish that mapping is unrelated to the website quality, business size or other characteristics of interest.
OpenStreetMap's website-tag documentation describes a link to the official website for a feature. Requiring that tag excludes features without it. A business may have a website that has not been recorded, or no website at all. Those are not necessarily equivalent groups.
The elements documentation also distinguishes points, ways and relations. A query that includes only one representation can miss mapped features recorded in another form. The data model affects which businesses enter the frame before any website is visited.
The practical lesson is specific: a price-independent frame can be preferable for this question, but price independence alone does not make it fair, complete or representative. Coverage needs its own inspection.
Preserve the old observation without expanding its scope
The historical account recorded 28 of 42 scored websites as publishing a monthly price, approximately 66.7%. It also described 51 attempted cases, giving 28 divided by 51, approximately 54.9%, when unresolved cases were included in the denominator without adding positives.
Those calculations describe different treatments of the old cases. The second is a sensitivity calculation for that attempted group, not proof that unresolved websites truly lacked a price. It does not solve businesses missing from the frame altogether.
The old note also reported that 28 of 29 websites publishing any relevant price published a monthly one. That conditional observation is approximately 96.6%. It concerns the observed price-publishing subgroup, not every business and not a conclusion that no meaningful counterexample exists anywhere.
This revision does not recollect the websites or verify a current regional rate. It retains the historical counts and narrows what follows from them. Readers needing a present estimate need a new documented collection and a suitable sampling design.
Keep the collection stages in a small table
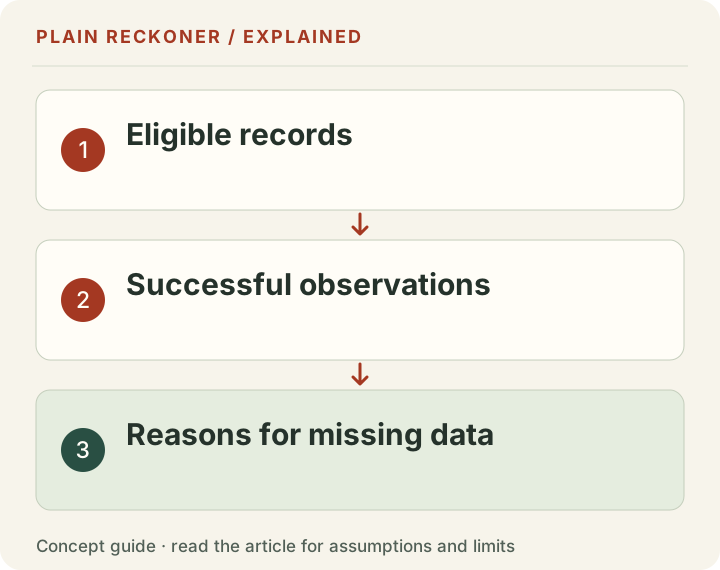
Record how many entries were in the frame, how many were selected, how many could be contacted or fetched, how many were eligible and how many produced an interpretable outcome. These stages answer different questions.
Do not call every unreachable case ineligible. A timeout can concern a business that fully belongs in the target group. Do not call a successfully fetched homepage a completed price review if the method also requires inspecting a relevant rates page.
Use explicit statuses for duplicates, closed businesses, unreachable sites, unresolved identity and scored outcomes. A missing price, an ambiguous price and a missing page are not the same result. Keeping them separate makes later review possible.
A percentage should identify which stage supplies its denominator. This one habit prevents a report from using all sampled businesses for one favorable statistic and only easy completed cases for another without telling the reader.
Work through a coverage example
Consider chosen demonstration counts: a frame lists 200 businesses, of which 100 are selected. Eighty can be inspected, and 48 show the relevant field. The scored-site share is 60%, while confirmed positives among attempted cases are 48%.
If the 20 unresolved cases were all positive, the attempted-group share would be 68%. If none were positive, it would be 48%. This range expresses extreme assumptions about unresolved cases in that selected group. It is not automatically a statistical confidence interval.
It also says nothing about businesses absent from the 200-entry frame. If coverage omissions are associated with the outcome, collecting more from the same list may not remove the bias. A larger sample reduces some uncertainty while leaving the coverage problem intact.
Label demonstration arithmetic as demonstration arithmetic. Do not merge these chosen counts with the historical 28-of-42 result or present them as a newly observed dataset.
Match geography to the actual question
A rectangle around part of a state is not the same as a state boundary. A query can be technically valid and still collect the wrong geographic population. Plot the selected area before interpreting its count.
The Overpass query-language reference documents different selection mechanisms. Read the relevant query behavior and test it against known cases instead of assuming a familiar-looking boundary produces the intended sample.
Record whether selection is based on a feature's location, geometry or another criterion. A large site crossing a boundary can behave differently from a point. If the research unit is an operating business, inspect whether the geospatial selection actually identifies it once.
These implementation details belong in the evidence chain. A region-level conclusion cannot be repaired merely by adding a general disclaimer if the query did not cover the region it claimed to represent.
Check identity and duplicates before calculating shares
One business can appear through multiple map elements, websites or directory entries. Several businesses can share one domain. Decide how those cases are handled before the outcome is known, and preserve the join rule.
A duplicate is not always obvious from the name. An operating company may use a trading name, or one location may have several landing pages. Review a sample of merged and unmerged cases to see whether the rule makes sense.
Keep source identifiers and capture dates. That allows a reviewer to trace an observation without assuming that a website's current contents match the historical capture. The record should make clear whether the result belongs to a business, location or page.
Do not remove duplicates only among negative results or retain repeated positives because they make the sample larger. A consistent unit is essential to a meaningful denominator.
Do not combine unlike studies into a statistical band
The earlier note discussed a separate trade-directory observation of 42.8% among 278 listings. A self-completed directory field and a direct website inspection can have different definitions, populations and dates. Their estimates should not automatically become the endpoints of a 43–67% market range.
A useful comparison describes those differences first. Does the directory ask the same question? Are blank fields confirmed negatives or unanswered prompts? Does the list cover the same region and business type? Are the businesses selected through the same process?
If the answers differ, present the studies as separate pieces of context. A disagreement can suggest a measurement question without proving that either estimate bounds the true value. Similar-looking percentages are not enough to establish comparability.
This principle applies to ad-blocking surveys and publisher traffic as well. A person-level survey and a site-level request count can differ legitimately. The blocking-measurement note shows why matching the denominator matters.
Do not attach an unsupported margin of error
A familiar uncertainty formula does not turn a convenient list into a representative probability sample. Sampling uncertainty and selection bias are different problems. A narrow numerical interval can sit around an estimate that systematically misses part of the population.
Describe the actual selection process, including whether it was random within the frame. If it was not, avoid language that implies every eligible business had a known chance of inclusion. If the frame itself has gaps, explain those too.
When the project cannot support a population estimate, a descriptive case study can still be valuable. It can show collection feasibility, identify ambiguous fields or test a parser. The conclusion should match that narrower purpose.
Before publishing a formal inference, use a documented method appropriate to the design and have the assumptions reviewed. Do not add a statistical badge merely to make an exploratory dataset look more authoritative.
Apply the lesson to customer-feedback work
A reader test recruited from existing fans can reveal useful misunderstandings, but it does not measure how every new customer understands a page. The same selection question applies: what made someone available and willing to participate?
Record existing familiarity, relevant circumstances and recruitment source where appropriate. Keep those details separate from personal identifiers. Ask neutral questions and preserve responses rather than manufacturing a universal clarity score.
The Reader Check helps organize a facilitated exercise; it does not supply a representative audience automatically. The Test Planner can record the question, sample source and limits before the team interprets results.
The underlying discipline is the same across maps, marketplaces and interviews. Define the group, describe the route into the list and keep every important exclusion visible. A smaller honest claim is more useful than a market-wide percentage whose denominator changes whenever the story needs it.
Pilot the field definition before scaling collection
Have two reviewers inspect the same small set of pages using a written rule. Compare which cases they call a relevant price. Disagreement can reveal that the field is not yet defined clearly enough for a reliable larger collection.
For example, distinguish a starting rate from a complete quote, a short-stay rate from a monthly offer and an old archived document from a current page. A parser cannot resolve an undefined concept simply by finding a currency symbol more quickly.
Record ambiguous examples in the protocol so later reviewers use the same interpretation. If the definition changes, identify which earlier records need reassessment. Do not preserve old classifications under a new definition without checking them.
Publish the table behind the headline where appropriate
A useful public table can include non-sensitive source identifiers, observation status, relevant date and field interpretation. Readers can then inspect why a case counted, rather than having to trust an unexplained total.
Respect source rights and avoid publishing personal information the research does not need. A transparent method does not require distributing every raw response or confidential note. Explain what is available, what has been withheld and why.
Keep versions stable enough for citations. If a later review changes a classification, preserve a dated record of the change. That is more informative than silently replacing the download while leaving old articles with totals nobody can reproduce.
Decide what evidence would justify the next claim
An exploratory collection may justify a larger pilot, a parser revision or a narrower research question. A representative market estimate requires more: a suitable frame, clear inclusion rules, a defensible selection process and treatment of unresolved outcomes.
Write those missing requirements before deciding to collect thousands more rows. Extra volume can be useful, but only when it addresses the uncertainty that matters. If the problem is coverage, another batch from the same incomplete list may repeat the same limitation at greater cost.
The next step is therefore a design decision, not a race for the largest spreadsheet. Build the evidence needed for the actual question and label the result at the level the method supports.