
A product can have a healthy-looking markup and leave almost nothing after selling costs. The problem is often the denominator—or the costs that the headline leaves out.
Margin and markup answer different questions. Neither automatically measures the money left after advertising, shipping, refunds and overhead. Use them with clear labels before deciding a product can support a bigger discount or ad budget.
Margin versus markup: one product, two percentages
Suppose an item costs $30 and sells for $50 after product discounts. Its product gross profit is $20.
| Measure | Calculation | Result |
|---|---|---|
| Product gross profit | $50 − $30 | $20 |
| Product gross margin | $20 ÷ $50 | 40% |
| Product markup on cost | $20 ÷ $30 | 66.67% |
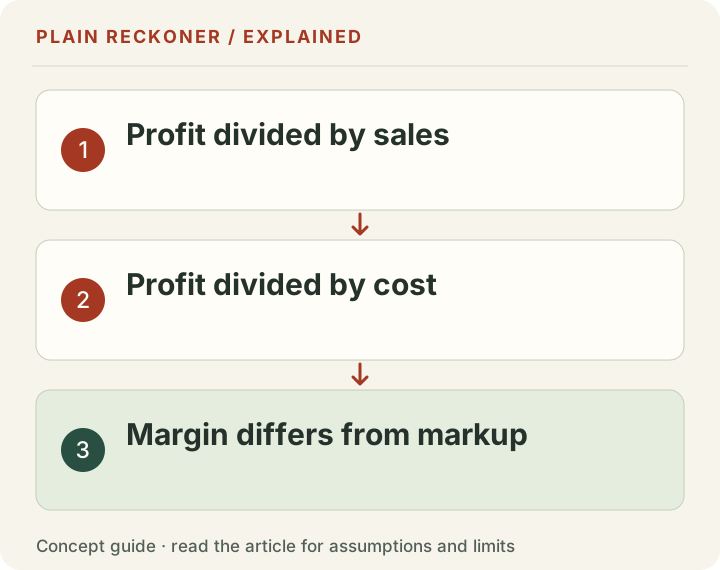
Both percentages describe the same $20. Margin divides by selling revenue; markup divides by product cost. Switching the denominator changes the percentage without changing the money.
This is a worked example, not an observed industry average. There is no single good margin that applies to every product, country or selling channel.
How $20 becomes twenty cents
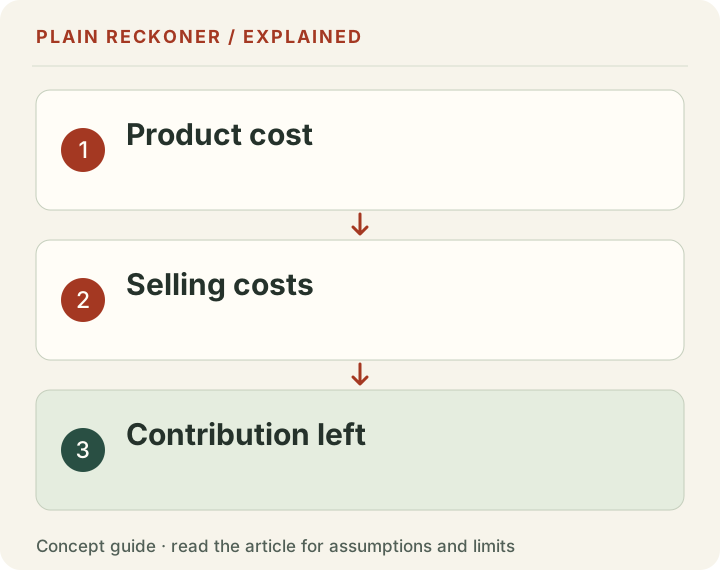
Now add selling costs to the same order. Assume a 3% percentage fee plus $0.30 fixed fee, $8 shipping and packing, and $10 advertising cost. These are example assumptions, not a provider’s current price list.
| Item | Amount |
|---|---|
| Product revenue | $50.00 |
| Product cost | −$30.00 |
| Percentage and fixed fee | −$1.80 |
| Shipping and packing | −$8.00 |
| Advertising cost | −$10.00 |
| Contribution after these costs | $0.20 |
The product still has a 40% product gross margin and a 66.67% markup. But contribution after the entered selling costs is only 0.4% of product revenue. Tax, returns, overhead and owner pay could lower the business result further.
That is why a markup headline can be true and still be a poor basis for an advertising decision. The missing costs matter more than the impressive percentage.
Check what your report includes
Shopify’s profit-report guidance explains the role of recorded product costs. Check that costs existed for the relevant products when the sales happened. A missing cost is not proof the product cost nothing.
Then check the report’s exact definition. Product gross profit and an order-level contribution calculation may include different costs. A number labelled profit is not automatically net profit after every business expense.
Keep product revenue separate from tax and customer shipping charges when using the worked formula here. If a marketplace report includes other amounts, reconcile them rather than copying a total into a merchandise-sales field.
Do not mix markup with a margin input
The free shipping threshold calculator asks for product gross margin on sales. Entering 66.67% markup where it expects 40% margin makes each extra dollar of basket value appear to contribute too much.
For positive product cost and selling price:
Margin rate = markup rate ÷ (1 + markup rate).
Markup rate = margin rate ÷ (1 − margin rate).
Use rates, not whole percentages, in those formulas: 66.67% is about 0.6667. When product cost is zero, markup on cost is undefined. When revenue is zero, margin on revenue is undefined. A blank denominator should not quietly become a reassuring zero-percent result.
The order contribution and ROAS calculator shows product gross margin and markup under “More results and denominators.” It also shows the contribution left after entered fulfillment, fees, refunds and advertising. Keep those measures distinct.
Discounts reduce more than the margin headline suggests
Cut the $50 price to $45 while keeping the $30 product cost. Product gross profit falls from $20 to $15: a 10% price reduction has removed 25% of product gross profit.
Selling fees may fall with the price, but shipping and fixed fees may not. Advertising cost per order may also stay the same. Recalculate contribution before assuming a small discount needs only a small increase in volume.
Our inventory markdown guide explains how to compare a discount with the extra units needed to preserve contribution. It does not predict that the extra sales will happen.
Refunds need the original order context
A product refund reduces revenue. A physical return can recover some product cost into usable stock. Those are different events, and stock recovery is not a second cash sale.
For a matched set of orders, calculate net product sales after matched refunds and net product cost after any supported stock-cost recovery. Do not subtract all refunds received this week from this week’s sales if they relate to a different set of orders and then call it a clean cohort margin.
Use the return-cost guide to compare a kept order with a fully returned one. Partial refunds, exchanges and damaged stock need their own treatment; a simple rate cannot describe every case.
What should you check before increasing ad spend?
Start with contribution before ads. That is the cost-aware room available to pay for advertising and a chosen contribution target. A revenue-based ROAS alone does not answer that question.
Google’s ROI guidance makes costs part of assessing return. The break-even ROAS guide shows how a 3× revenue ratio can still leave a loss under explicit cost assumptions.
For your next decision, write the percentage name and denominator beside the number: gross margin on sales, markup on cost, or contribution margin after the entered costs. Add the costs excluded from the calculation. Those small labels can prevent a large pricing mistake.
If you cannot reconcile the reports, request a free manual review. Share the question and public store URL rather than customer-level data. The aim is to make the decision understandable, not to substitute a generic target for your own economics.
Why adding 40% to cost does not create a 40% margin
This mistake often starts with a simple instruction: “We need forty percent, so multiply cost by 1.4.” With a $30 cost, that produces a $42 price. The $12 product gross profit is forty percent of cost, but only about 28.57% of the $42 sales revenue.
To obtain a chosen product gross margin, divide cost by one minus the margin rate. For a 40% target, $30 ÷ 0.60 gives $50. This is a product-level pricing identity. It does not include the shipping, fees and advertising in the earlier contribution example.
Swipe or scroll the table horizontally to see every column.
| Pricing instruction | Calculation | Price | Product gross margin |
|---|---|---|---|
| Add 40% to cost | $30 × 1.40 | $42 | 28.57% |
| Keep 40% of sales above product cost | $30 ÷ 0.60 | $50 | 40% |
| Double cost | $30 × 2 | $60 | 50% |
A 100% markup therefore produces a 50% product gross margin, not a 100% margin. These statements assume positive costs and prices. A loss-making sale can produce a negative margin; the formula should show that plainly rather than force the result into a zero-to-one-hundred display.
When discussing a target with a supplier, colleague or agency, ask for the actual calculation. “Forty percent profit” is too vague. Write “forty percent product gross margin on sales, before fulfillment and advertising” if that is what you mean. Clear words are part of cost control.
Find a price that covers the named selling costs
You can extend the earlier order example without pretending to know demand. Suppose the product still costs $30, fulfillment is $8, advertising is $10, the fixed selling fee is $0.30 and the percentage selling fee is 3% of product revenue. You want $5 contribution left after these named costs.
The fixed-dollar costs plus the target are $53.30. Each dollar of price leaves $0.97 after the assumed percentage fee. The required price is therefore $53.30 ÷ 0.97, or about $54.9485. Rounding upward to $54.95 clears the arithmetic target under those exact assumptions.
At $54.95, the percentage fee is $1.6485. Subtract that, the $0.30 fixed fee, $30 product cost, $8 fulfillment and $10 advertising. The result is $5.0015 before other excluded costs. Rounding the fee to cents can change the final pennies, so apply the actual provider's rounding rules when reconciling a real order.
This is a cost floor for a stated scenario, not a recommendation that customers will accept $54.95. It also assumes the percentage fee applies only to the price modeled here. Some actual fees use a base including shipping, tax or other amounts. Replace the assumption with the actual statement rather than copy the example rate.
Use a separate calculation if you want contribution to be a percentage of sales rather than a fixed $5. A fixed target and a percentage target answer different questions. Neither includes overhead automatically.
One product can have several channel margins
Selling the same item through your own store and a marketplace can leave different amounts. A marketplace may have referral, fulfillment, storage, promotion or return-related charges. Your own store has its own payment, software and acquisition costs. Compare complete records instead of assuming one channel is always cheaper.
Start with the same item and an explicitly matched price basis. Then list the costs that differ. If the marketplace handles shipping but your store's calculation includes your own postage, take care not to count both. If one channel price includes a discount and the other is list price, call out that difference before interpreting the margin.
Give shared business expenses their own treatment. A monthly software subscription is not automatically a per-order variable cost, although you may allocate it when studying full business profitability. Show the allocation rule separately. Dividing it by last month's orders gives a historical average, not necessarily the cost of the next order.
This is especially important when comparing a busy month with a quiet one. More orders can lower allocated overhead per order without changing the underlying product cost. That does not establish a better supplier deal or a cheaper delivery operation.
Compare the mix before celebrating a better margin
A storewide margin is sales-weighted. You cannot generally average individual product percentages and get the store's margin.
Consider two chosen product groups. Group A generates $1,000 sales and $600 product cost, leaving $400 gross profit and a 40% margin. Group B generates $100 sales and $20 cost, leaving $80 and an 80% margin. The simple average of their percentages is 60%.
But together they generate $1,100 sales and $480 product gross profit. The combined margin is $480 ÷ $1,100, about 43.64%. The larger low-margin group carries more weight. The 60% average overstates the product gross margin on actual combined revenue.
Now imagine sales shift toward group B. Store margin can rise even if neither product's price or cost changes. This is a mix effect, not proof that every product became more profitable. Total contribution might still fall if the higher-margin items sell in much smaller quantities or bring higher selling costs.
For a useful comparison, keep three views: dollars of contribution, contribution per order and the relevant rate. A percentage can improve while total dollars worsen. A dollar total can improve while each additional order contributes less. Each view helps answer a different operating question.
Build a small pricing review sheet
Create one row per product or a clearly defined group of similar orders. Include the selling price after discounts, cost basis, fulfillment, actual fees and the advertising allocation you intend to use. Record whether shipping is paid by the customer, the store or both.
Add a source and date beside each cost. A supplier invoice supports a purchase cost. A shipping invoice supports paid delivery charges. A fee statement supports actual payment charges. An estimate should remain labeled an estimate until you have the record. Do not give an uncertain input extra authority by displaying four decimal places.
Shopify's sales definitions are useful when reconciling an export: product sales, discounts, reversals, shipping and tax are distinct reporting concepts. Match the definition you need instead of copying the largest sales total available.
Review unusual rows before changing prices across the whole store. A missing cost, duplicate fee or misplaced refund can create an apparent winner or loser. Then examine the real weak rows: a high fixed fee on a small basket, expensive shipping, a heavy return burden or a discount that removed most of the original contribution.
Choose the next test from that explanation. A basket problem might call for a carefully priced bundle. A fulfillment problem might call for a packaging or shipping review. A product-cost problem might call for a supplier conversation. Raising every price is not the only response, and lowering every price to chase volume can make the problem larger.
Keep the review understandable enough that another person can reproduce it. The useful output is not a badge saying “good margin.” It is a price, a defined cost basis, the contribution that remains and the assumptions that could change it. Use the free store tools to test those linked decisions before committing to an offer.
Know when a calculation should stop
A margin calculator should not turn missing inputs into a confident recommendation. Zero sales means the margin-on-sales denominator is unavailable. Zero product cost leaves markup-on-cost unavailable even though you can still examine contribution. Negative stock recovery, a recovery larger than original product cost or a refund counted twice needs correction before interpretation.
Very large values deserve the same care as small ones. Check the currency and whether the source reports cents, dollars or thousands. A file using decimal commas can be misread by a system expecting decimal points. Confirm a few source rows manually before trusting the combined result.
Finally, keep historical and planned prices separate. The margin earned on last month's completed orders is evidence about those orders. A proposed higher price is a scenario. It may change demand, discounts, returns or customer mix. The arithmetic can describe the scenario exactly while the commercial outcome remains uncertain.
An ecommerce profit margin calculator needs a named profit figure
Gross profit, contribution and net profit answer different questions. If an example item sells for $50 and its product cost is $30, gross profit is $20 and gross margin is 40%. Markup on the $30 cost is about 66.67%. Neither calculation has yet paid for delivery, processing, returns, advertising or overhead.
An ecommerce net profit margin uses the profit remaining after the expenses included in the business's accounting measure. A product-level calculator usually does not know every business expense, so call its output contribution when that is what it calculates. Comparing that number with another company's net margin would hide the difference in scope.
Before comparing ecommerce profit margins, list the included costs, period, currency and refund treatment. Use the same definition on both sides. There is no single ‘good’ margin that overrides the cost structure of the actual order.