
Three dollars of sales for every advertising dollar sounds good. It can still leave a loss. ROAS tells you how one recorded value compares with ad spend. It does not automatically tell you what you keep.
Use our free break-even ROAS calculator to put the missing costs beside the ratio. It accepts matched refunds, returned-stock cost recovery and actual selling fees. Your figures stay in your browser.
The worked examples assume no customer-paid shipping. In the calculator, add shipping revenue after matched shipping refunds separately, and include fees on those receipts in actual fees. Product ROAS and product gross margin keep their product-sales denominators.
What does ROAS actually measure?
For a revenue-based report, ROAS = attributed sales revenue ÷ advertising spend. $9,000 of sales divided by $3,000 of ads is 3×, also written as 300%.
Check the numerator before using that formula. Google Ads conversion values can represent values assigned to conversions, including revenue or other business values. A report using an assigned lead value is not the same as a merchandise-sales report.
Attribution also needs a separate check. A sale credited to a campaign is not proof the customer would never have bought without that campaign. This guide calculates costs; it does not establish incremental ad performance.
How a 3× ROAS turns into a loss
Here is a worked example for one matched set of orders, not measured campaign performance:
| Cost or sales figure | Example |
|---|---|
| Product sales after discounts | $9,000 |
| Product costs | $5,400 |
| Shipping and packing | $900 |
| Selling and payment fees | $270 |
| Contribution before advertising | $2,430 |
| Advertising spend | $3,000 |
| Contribution after advertising | −$570 |
The campaign still reports 3× revenue ROAS. But $2,430 was available for advertising, and the campaign spent $3,000. Rent, salaries, tax and other costs could make the business result lower again.
This is why we call the result contribution, not net profit. You can inspect every subtraction rather than assume a universal “good ROAS.”
Calculate break-even ROAS with the same sales basis
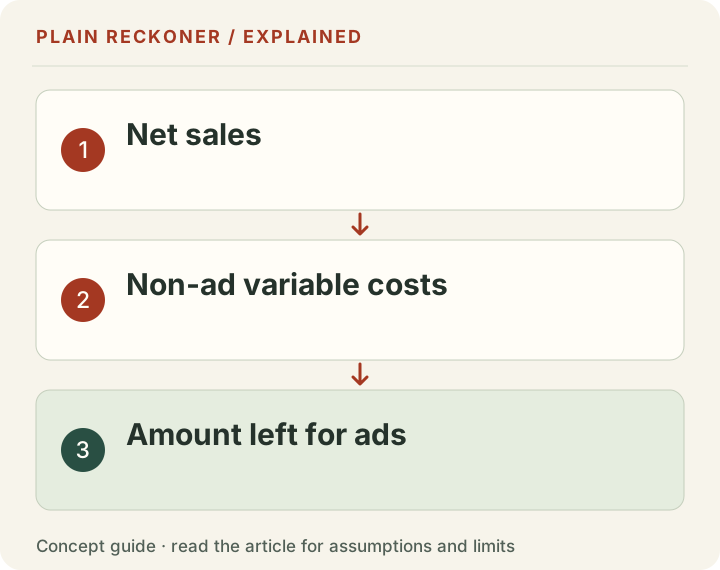
In this example, the revenue-based break-even ratio is $9,000 ÷ $2,430, or about 3.704×. A displayed two-decimal requirement should round up to 3.71×, not suggest that 3.70× clears the exact cost floor.
A common shortcut says break-even ROAS = 1 ÷ margin rate. That works only when the margin is the right contribution before ads divided by the same revenue numerator. Using product gross margin while leaving out shipping and selling costs makes the threshold too low.
Google's ROI explanation also separates revenue from the costs involved in producing and selling it. ROAS and ROI answer different questions. Keep both definitions explicit when comparing reports.
Refunds can change both sides of the calculation
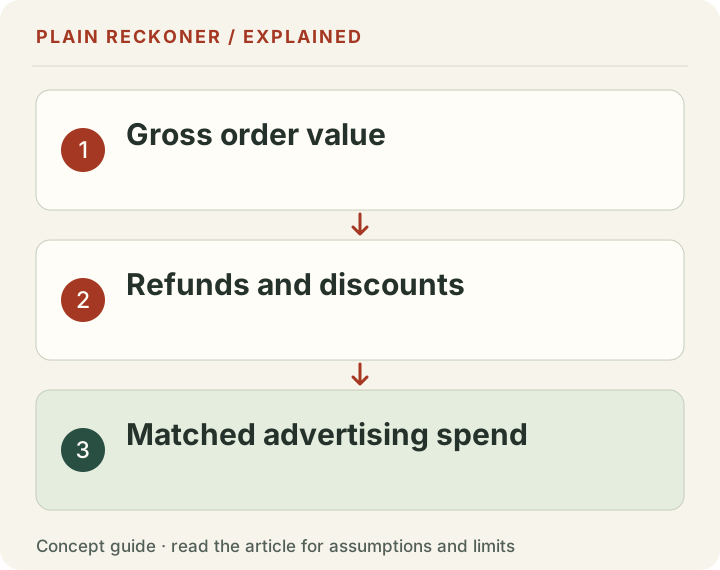
Suppose a matched order cohort has $10,000 in pre-refund product sales and $1,000 in product refunds. Sales after those refunds are $9,000. Do not continue calling $10,000 the money retained from customers.
But do not simply subtract refunds twice either. If your sales input already excludes refunds, subtracting the same refund total again understates sales. Our calculator labels its sales input as after discounts, before refunds so the separate refund field has one clear job.
Shopify's sales report definitions distinguish net sales, total sales and payments. Total sales can include amounts such as tax and shipping. Sales reports also track broader reversals, including edits and cancellations. Those should not silently become a physical-return rate.
Match your refunds to the original orders when assessing a cohort. Refunds processed this week may relate to ads and orders from an earlier month. Two totals with matching calendar dates do not necessarily describe the same customers.
Recovered stock is not extra sales revenue
A returned item may go back into usable inventory. If its original product cost was $24 and you recover $20 of that cost into stock, the cost loss is different from discarding the item.
That recovery is stock value, not a second $20 cash payment from the customer. Enter it as a product-cost recovery, capped by the cohort's original product cost. Do not add it to sales revenue or include a hypothetical future resale.
Our return cost scenarios let you examine full returns, retained fees and recovery assumptions in more detail. Partial refunds and mixed product returns need a more specific cohort calculation.
Your affordable ad budget depends on your target
In the calculator's separate worked cohort, $10,000 sales, $1,000 refunds, $4,000 product cost, $200 recovered product cost, $1,000 fulfillment, $300 fees and $100 return handling leave $3,800 before ads.
If you want $500 of contribution left, the ad budget is $3,300. Across 100 orders, that is $33 per order. At $2,500 actual ad spend, contribution is $1,300.
These figures are conditional cost checks, not bidding recommendations. If your chosen target is already missed before ads, the tool shows an unavailable target budget. It does not invent a negative spending allowance.
What to check before increasing spend
Use one defined order cohort, one currency and one sales basis. Reconcile product costs, actual fees and fulfillment. Separate recorded sales, payments and refunds. Then decide what contribution must remain for the costs outside the model.
For discounts, the inventory markdown test shows how a lower price changes the units needed to recover contribution. For shipping offers, use the free shipping threshold calculator. Both can change your affordable ad cost.
Open the ROAS calculator with your own figures. If the reports do not reconcile, ask for a free manual review and describe which dates and definitions differ. Do not send customer records or account credentials.
A real reporting gap: products without recorded costs
Before looking for a better ad campaign, check whether the profit report includes all the products you sold. This is a practical issue in a real store platform, not a theory about advertising.
Shopify's profit-report documentation says product costs must have been recorded when the item sold for it to appear in the relevant product-profit reporting. Variants need their own cost records. Missing costs can therefore leave a different sales population in the profit report than in the sales report.
That does not mean every Shopify store has this problem. It gives you a specific check to perform: compare the orders and variants covered by each report before combining the totals. A complete-looking dashboard can still answer a narrower question than you intended.
Suppose your sales report covers 100 orders, but your exported product-profit rows cover 80. Dividing the profit from those 80 orders by sales from all 100 does not establish the contribution rate of the whole cohort. It combines unlike populations. Recover the missing costs from purchase records, or clearly report the covered subset and leave the rest unresolved.
There is another distinction. Product gross profit does not necessarily include every shipping, payment, return and advertising cost in this guide. Read what each field includes. A cost entered as a purchase price may omit freight you separately paid to receive the stock. Do not add that freight twice if your recorded product cost already includes it.
A useful reconciliation ends with three matching totals: orders in scope, product sales in scope and product costs in scope. Only then add the other costs. This is less exciting than a new bidding trick, but it prevents a false spending allowance from reaching your ad account.
Convert the result into a cost-per-order limit
A ratio becomes more useful when you connect it to one order. Return to the separate 100-order cohort above. Its $3,800 contribution before ads gives $38 per order before advertising. A $500 total contribution target means keeping $5 per order. The remaining allowance is $33 per order for ads.
The $33 is an average across that defined cohort. It is not permission to spend $33 acquiring every product or customer. If one item has $12 before ads and another has $60, the same allowance would lose money on the first and leave room on the second. Product mix matters.
Also check what the campaign counts. If it records 120 purchase events for 100 genuine orders because tracking duplicates some events, dividing spend by 120 understates actual cost per order. If a customer places two orders, cost per order and cost per new customer also differ. Use a count whose meaning matches the decision.
For a new-customer campaign, separate new customers from repeat buyers rather than relabeling every order as a new acquisition. Our customer acquisition cost guide explains that distinction. A customer-level budget may include later purchases, but future revenue needs its own cost, timing and retention assumptions. It cannot be borrowed from an optimistic lifetime-value headline.
Finally, compare this allowable average with the cost of the next spending increment. An account averaging $25 per order can still acquire its next small batch at $45. The average tells you what already happened. It does not prove that increasing spend preserves that average.
Stress-test the costs before raising the budget
A single result hides how sensitive the decision is. Keep the 100-order cohort fixed and change one cost at a time. This is a planning exercise, not a measured forecast.
Swipe or scroll the table horizontally to see every column.
| Change from the $3,800 starting contribution | Before-ad contribution | Budget leaving $500 | Budget per order |
|---|---|---|---|
| No change | $3,800 | $3,300 | $33 |
| Fulfillment costs rise $400 | $3,400 | $2,900 | $29 |
| Selling fees rise $100 | $3,700 | $3,200 | $32 |
| Both cost changes happen | $3,300 | $2,800 | $28 |
These rows keep sales, refunds, stock recovery and order count unchanged. Real decisions can change several of them together. For example, a free-shipping offer may increase orders while also changing basket size and shipping cost. A discount may increase conversion while reducing money left per order. Test the linked effects rather than claim the fixed-cohort table predicts them.
For refunds, rebuild the matched cohort instead of making a casual adjustment. An extra refund might reduce sales, return usable stock, incur handling costs and retain a payment fee. Those are separate entries. A single guessed percentage may hide the most important difference between two products.
Write a conservative case beside your central case. Use specific reasons, such as a carrier quote or a known fee schedule, rather than label an arbitrary estimate “worst case.” If the decision works only under the most favorable assumptions, that is useful information before you spend.
Keep cash timing separate from contribution
A profitable cohort can still strain cash. The supplier may need payment before the customer buys. The ad platform may charge before your payment processor releases funds. A refund can happen after the original payout. None of those dates is visible in a revenue ROAS ratio.
Make a short cash calendar next to the contribution calculation. List the expected dates of stock payment, freight, ad charges, customer receipts, processor payouts and likely refunds. Include a reserve for costs you know are coming. This does not change the arithmetic of contribution; it answers whether you can fund the activity while waiting for receipts.
Do not count inventory recovery as money available to pay tomorrow's advertising bill. Stock has value only under a stated valuation and may need to sell again before providing cash. Likewise, a sale booked today is not necessarily cleared money in the bank.
Our cash flow versus profit guide covers that second view. Keep both views visible when deciding whether to grow. “The ads are profitable” and “we can safely fund more orders this week” are different conclusions.
A repeatable weekly decision, without a universal target
Start each review with the same short record: cohort definition, reporting currency, sales basis, cost coverage and refund cutoff. Save the report export and note which costs are estimates. Repeatable definitions matter more than producing a new ratio every morning.
Then reconcile the main totals. If they do not match the source records, resolve that first. If they do match, inspect which products, audiences or offers changed. A blended store ratio can improve because more repeat buyers purchased, while the new-customer campaign became more expensive. A campaign ratio can improve while overall store contribution falls because a low-margin offer dominates sales.
Choose an action tied to the explanation. Incomplete costs call for better records. A shipping subsidy calls for a threshold test. A low-margin product calls for pricing or sourcing work. A tracking discrepancy calls for measurement repair. These are different problems; buying more traffic is not a shared solution.
When testing a change, record what would make you stop, what result would support continuing and when enough complete orders should be available to review it. Keep other major changes limited where practical. This makes the next comparison easier to interpret, though an ordinary before-and-after check still does not prove causation.
The useful end point is a sentence you can defend: “For these orders, after these named costs, we had this much available for ads and kept this much afterward.” That is a stronger starting point than copying somebody else's target ROAS. Start with your store figures and keep the assumptions beside the answer.
Keep a separate record for each currency. A converted sales total and an unconverted cost total can produce a convincing but meaningless margin. Record the exchange-rate basis and date where conversion is needed. If tax treatment is unclear, resolve it with a qualified adviser before treating the remainder as spendable profit.
Break-even ROAS formula: use the margin before advertising
Break-even ROAS is 1 divided by the contribution margin before advertising, expressed as a decimal. In an arithmetic example, a $100 order leaves $25 after the matched product, delivery, payment and return costs but before ads. The margin is 0.25, so the break-even ROAS is 4. Spending $25 to produce that $100 order uses up that contribution.
This threshold covers only the costs you included. It does not automatically pay overhead, tax or owner time. If the contribution before ads is zero or negative, there is no positive advertising budget that makes the same order break even under those inputs. A break-even ROAS calculator should make that condition clear instead of returning a reassuring target.
Use your matched cohort in the break-even ROAS tool. Keep gross sales, refunds, recovered product costs and ad spend on a consistent basis. A platform's reported return on ad spend can use different attribution or revenue rules, so check the export before comparing the two.