
A search spike can suggest a question worth testing. It does not tell you how many products will sell. Before buying stock or publishing dozens of near-identical pages, separate public interest from your own evidence of demand.
Google’s Trends data explanation describes sampled, normalized search data. Its 0–100 scale expresses relative interest within the selected context. A score of 100 is a relative peak, not 100 searches, 100 customers or a conversion forecast.
Why this matters for holiday planning in 2026
Google’s 15 October holiday shopping guide uses historical search and discount patterns to describe shopping timing. That can suggest what to investigate. It does not promise that the same pattern will repeat for your category or store.
Record the geography, dates, search type and whether you compared search terms or topics. Compare alternatives in the same Trends request where appropriate. Two separately normalized charts with a score of 100 do not establish equal search counts.
Write one decision before collecting data
Choose a useful question: are people looking for a repair guide, a price comparison, a product specification or a place to buy? A popular informational query can be a poor match for a purchase page. Read the results and the underlying question before treating a trend as a sales opportunity.
For a store, the decision might be whether to prepare a small stock trial. For a publisher, it might be whether to expand a genuinely useful guide. Set a modest next action that can be revised instead of committing a large budget based on a public index.
Publish a useful test page
Give the page a clear job. Explain the product or problem, its limits and a practical next step. Use your own calculations or observations where possible. Link the underlying sources and date anything that can change. Do not create a page for every tiny wording variation.
If the product is not available, say so. Do not present a fake checkout, invented sales count or false scarcity to measure clicks. Interest gathered under a misleading promise is poor evidence and damages trust.
Google’s people-first content guidance is a better publishing rule than an article-count target. A useful new page should answer a distinct need that the existing page does not already cover.
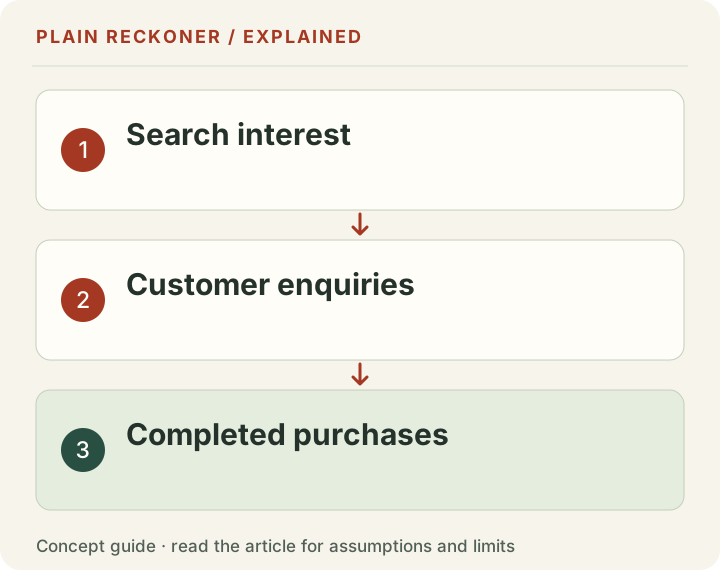
Measure separate stages
| Stage | What it can show | What it does not prove |
|---|---|---|
| Trends interest | Relative public search interest | Your product’s sales volume |
| Search Console impressions | Your page appeared in reported search results | A person visited or bought |
| Search clicks | A reported search visit began | A completed or incremental sale |
| Store orders and refunds | Your recorded transactions and reversals | Every order was caused by that page |
| Contribution | Revenue remaining after the entered costs | Cash already in the bank or total net profit |
Use existing Search Console performance reports, your hosting analytics and your store records. A separate visitor recorder is not needed for this basic workflow.
Do not overread an early click rate
A worked page receives 500 impressions and 10 clicks: 2% CTR. Another window has 500 impressions and 15 clicks: 3%. That is five extra clicks and one percentage point of difference. It is not proof that a headline caused a lasting 50% improvement.
Query mix, position, device, seasonality and search presentation may have changed. Keep the date ranges and query/page filters. Use the result to decide what to inspect next, not to announce a winning experiment before enough comparable observations exist.
Connect interest to a cost limit
Before buying stock, use the inventory markdown tool or order contribution calculator to understand the costs your offer must cover. The retail market explorer gives dated UK aggregate context; it is not a forecast for your product or a global demand database.
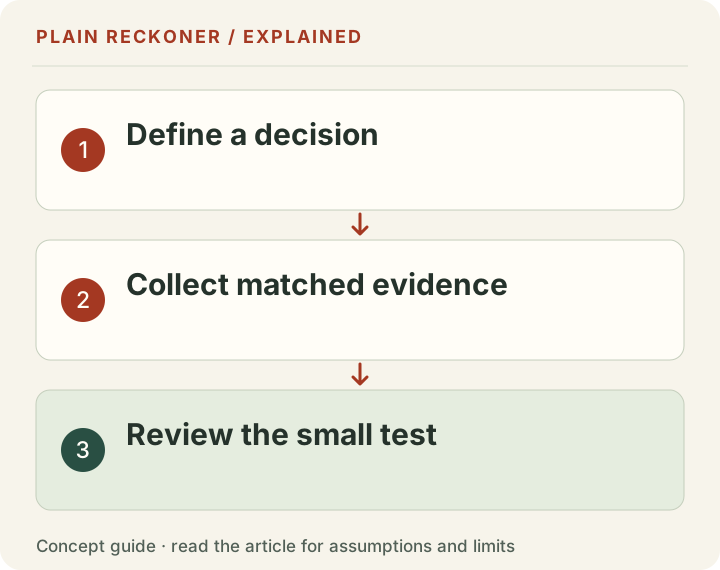
The practical loop is simple: ask a clear question, publish something useful, collect the existing reports, inspect the result and choose the next small step. The test succeeds when it improves a decision—even if it tells you not to expand the idea.
Begin with a comparison you can repeat
A useful Trends record includes the exact term or topic, geography, category, search type, period and export date. Save the query link and export where available. Those settings define the comparison; the number alone does not.
Take a fictional product idea only as a method example: reusable lunch containers. You might compare a broad product phrase with a more specific feature phrase, using the same country and period. The point is not that either phrase is currently trending. No live demand result for those terms is claimed here.
Read the related searches to understand the question. People may be seeking cleaning instructions, replacement parts, a recall notice or a retailer. A spike in attention to a problem can have a very different commercial meaning from a spike in purchase intent.
Google's term-and-topic comparison guidance distinguishes literal search terms from broader topic groupings. Do not switch between them halfway through a comparison and describe the change as demand growth. For multilingual work, record whether you used a topic or the actual local-language wording.
A normalized peak is not a market-size estimate
A relative index can rise because a topic takes a larger share of the searches in the selected setting. It does not give the number of people who will visit your store, the proportion who can afford the item or the quantity they will buy.
Consider two separately chosen examples, each normalized to its own peak. Product group A and product group B can both reach 100 in their own charts while having very different underlying search counts. You cannot infer equal market size from equal separately normalized peaks.
Compare alternatives in a consistent context and retain the settings. Even then, the output is a search-interest comparison, not a sales forecast. Do not multiply a Trends score by a guessed conversion rate and label the result predicted orders. The score is not an absolute number of visitors to which that rate can be applied.
Low-volume zeros also need care. Google's FAQ says very low search volume can appear as zero and describes statistical noise. A zero is not proof nobody wants the product, and an isolated tiny-series spike should not be treated as a confirmed buying wave.
Use more than one time window
A short window can show a recent burst. A longer one can reveal whether similar bursts recur. Look at both before buying stock for a seasonal item. Record whether you are comparing the same calendar period or simply adjacent periods.
A large increase from a small baseline can look exciting. A topic moving from a low relative level toward its annual peak may still have little commercial relevance to your particular offer. Check the question behind the search and the context of the event.
A longer series is not automatically stable either. The category, search behavior and competing products can change. Do not assume that several old holiday peaks prove the same opportunity will exist this year. Use historical patterns to prepare questions, then check current availability, prices and your own audience signals.
Keep the observation date distinct from the period. “Checked today” can refer to a chart covering years. A current article summarizing that chart should not describe every underlying observation as new.
Read news as context, not as your store's forecast
The October holiday guide linked above is a concrete example of a platform publishing shopping guidance from its own historical data. It can help identify timing questions, but it is not a guarantee about your costs, inventory or conversion rate.
When a news item triggers interest, check the original announcement. A product launch, policy change, recall or viral review can produce different needs. Read what actually changed and whether the audience needs an explanation, a compatibility check, an alternative or a place to buy.
Only publish the article you can support. If the news is about another country's market, say so. If the evidence concerns historical discounts, do not label it a confirmed future sale. If you lack the product or expertise to help, a popular headline alone is not a reason to create a page.
For a useful response, connect the event to a decision your readers face. Explain the source, date and practical limit, then add something original: a cost calculation, a comparison of definitions or a clear checklist. Repeating the announcement with extra keywords does not create the same value.
Design a small, honest commercial test
Before ordering a large batch, identify the smallest next action that can teach you something. That might be a clearly described product-interest page, a small available-stock offer or a guide leading to a genuine question form.
Do not advertise stock you do not have as ready to ship. If the offer is a preorder or interest registration, state that accurately and follow the applicable obligations. A misleading checkout can create clicks while producing poor evidence and unhappy people.
Choose the observation you need. A click on a product card indicates interest in seeing more, not a completed purchase. A request for availability is stronger than a pageview for that specific question, but it still is not paid demand. A completed order can later be canceled or refunded.
Write the cost limit before the test. Include stock, fulfillment, payment charges and acquisition costs. The useful question is not only whether anyone clicks, but whether the real offer can leave enough contribution if completed orders occur.
Build the funnel with actual denominators
A chosen test page has 1,000 recorded visits, fifty product-detail clicks and five completed orders. The product-detail click share is 5% of those visits. The completed-order rate is 0.5% of visits. The order share among those fifty clicks is 10%, assuming the same tracked path and cohort.
Those percentages are different views of a stated example. They are not ecommerce benchmarks, a Trends conversion model or proof all five orders were caused by the page. Missing tracking, multiple devices and other traffic paths can complicate the real measurement.
Then add money. If those five orders each leave $8 before the test's acquisition cost, the chosen cohort produces $40 before that cost. A $100 paid test leaves negative $60 under those assumptions, before other excluded expenses. A click-generating page is not necessarily a profitable offer.
Separate the stages so a strong early signal cannot hide a weak later one. High impressions with few clicks calls for one investigation. Many product views without orders calls for another. Orders with poor contribution require costs and pricing work, not merely a more clickable headline.
Compare the test with a relevant alternative
A single result needs context. What would you do with the same budget otherwise? You might improve an existing product page, test a different offer or keep the cash for stock that already sells. The alternative should be realistic and use the same cost basis.
Avoid moving the success threshold after seeing the result. If you intended to learn whether people would buy at a supported price, do not call pageviews alone a commercial success because no orders arrived. The pageviews can still teach you something narrower.
A small test often produces uncertainty rather than a definitive verdict. Record that. You may decide to gather more evidence, revise a specific assumption or stop because the next test costs too much. The value is a better decision, not a mandatory story of growth.
Keep the publishing plan coherent
For a publisher, useful interest research can identify missing explanations around a topic already relevant to readers. It should not turn the site into a collection of unrelated trending headlines.
Review existing pages before creating another. A current correction, clearer worked example or better source can be more useful than a second article answering almost the same question. If the new need is distinct, explain that difference and link the relevant existing work.
After publication, inspect actual page/query performance and the task the reader completes. Keep search visibility, visits, orders and contribution separate. Trends starts the investigation; it does not certify that the page will rank or that the product will sell.
Save the final decision with the query settings, dates and source receipts. That gives the next research cycle a real reference point instead of another screenshot of a peak labeled 100.
Distinguish category demand from your ability to serve it
A market can be interesting while your particular offer is uncompetitive or unavailable. Check the landed product cost, delivery time, returns exposure, credible product information and the alternatives a shopper can already choose. Search attention cannot compensate for an offer you cannot fulfill reliably.
For a content test, the equivalent question is whether you can add a useful answer. A trending topic with no original evidence, relevant experience or clear calculation may be a poor use of publishing time. An established question with modest attention can be a better fit if the current answers leave a concrete problem unresolved.
Keep that fit assessment separate from the public index. One describes search interest; the other describes your proposed service to the reader or customer. A strong opportunity needs both a real need and a defensible way to meet it. Neither is proved by a chart alone, and either can justify stopping an idea before a large stock purchase or a long content campaign.