
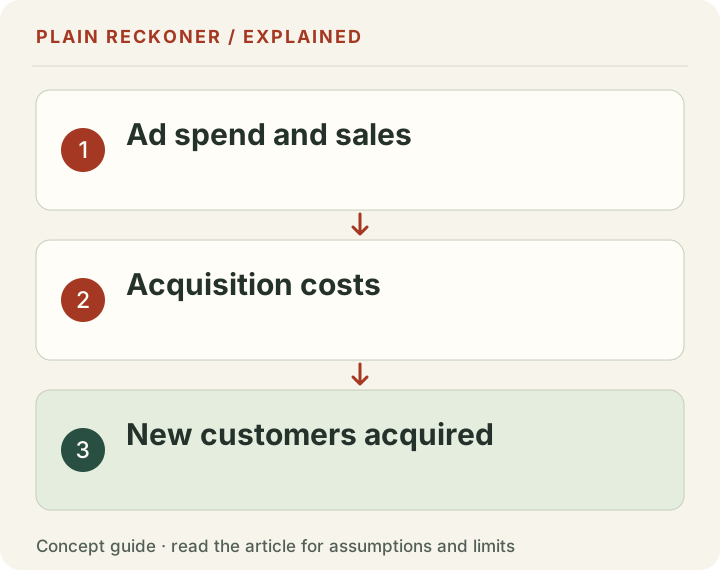
ROAS tells you revenue per advertising dollar. It does not tell you profit per new customer. A campaign can produce an impressive revenue multiple while the first order leaves too little to cover acquisition costs.
Shopify’s ecommerce metrics guide treats revenue, acquisition costs, margins and retention as related but different measures. The calculation below shows why they should not be collapsed into one score.
Use the same group and dates
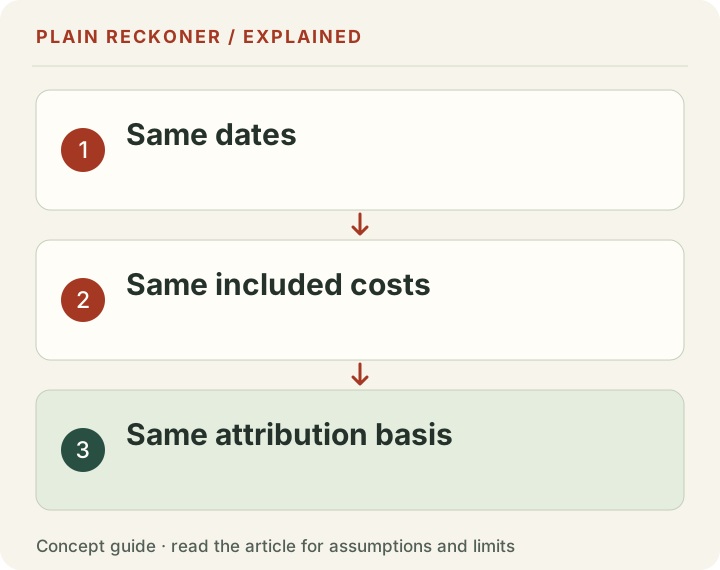
Suppose an acquisition campaign spends $1,000. In the chosen reporting window, 50 new customers place their first orders, producing $4,000 in product revenue. Assume the attributed revenue and customers refer to that same cohort.
| Measure | Calculation | Result |
|---|---|---|
| Revenue-based ROAS | $4,000 ÷ $1,000 | 4× |
| Ad spend per new customer | $1,000 ÷ 50 | $20 |
| Average first-order revenue | $4,000 ÷ 50 | $80 |
| Contribution before acquisition, chosen cost case | $18 per new customer | $900 total |
| Contribution after that ad spend | $900 − $1,000 | −$100 |
The first orders lose $2 per new customer after the allocated ad spend. A 4× revenue multiple did not change that cost result. Tax, overhead and other unentered costs remain excluded.
Say what your CAC includes
Ad spend per new customer is one measure. A fuller customer acquisition cost can also include costs such as campaign creative, agency work or acquisition staff, depending on the definition you adopt.
If another $500 is allocated to this same acquisition cohort, total acquisition cost is $1,500. Divided by 50 new customers, that is $30 each. Against the chosen $18 first-order contribution, the result becomes negative $12 per customer, or negative $600 for the cohort.
Label the cost basis. Do not compare an ad-only CAC with another business’s fully loaded CAC as though they were the same. Keep retention campaigns and repeat buyers separate if the question is acquiring a new customer.
Attribution is not proof of extra sales
A platform-attributed purchase is not necessarily a purchase caused by the ad. Different platforms can claim the same order. Reporting windows and modeled conversions can also differ. Google explains how conversion values are assigned; the selected value still needs to match your business question.
Use your order system to identify new customers consistently. Reconcile refunds and cancellations to the acquisition cohort. Do not count a canceled order as a durable new-customer success while subtracting its refund from a different month.
Repeat purchases are a testable assumption
A business may accept weak first-order economics if later purchases produce enough additional contribution. But predicted lifetime revenue is not cash already earned. Repeat orders incur their own product, payment, delivery and sometimes advertising costs.
Compare actual cohort contribution over consistent windows, such as 30, 60 and 90 days where enough time has passed. Mark incomplete cohorts. A customer acquired yesterday has not had the same opportunity to return as one acquired three months ago.
Avoid applying a generic lifetime-value-to-CAC target before checking definitions and data quality. A revenue-based lifetime value and a contribution-based acquisition test answer different questions.
Put a cost limit beside the dashboard
Use the order profit and ROAS tool to calculate contribution before advertising and an ad budget at your chosen contribution target. For an acquisition decision, use an acquisition-only cohort and include the appropriate costs. The tool’s budget per order is not automatically a measured customer CAC.
Then keep the cash-flow check nearby. Even if later purchases eventually cover acquisition, the business still needs cash to fund stock and ads first. A sensible acquisition plan names the cohort, cost basis, cash timing and uncertainty instead of relying on one green multiple.
New customers are not the same as purchase events
A purchase event counts a recorded purchase interaction. An order counts a transaction under the store's order rules. A new customer counts a person or customer identity making their first qualifying purchase. Those units can diverge even before you consider attribution.
Suppose a reporting period has 60 orders from 50 new customers because ten of those customers place a second order within the period. Dividing the same $1,000 ad spend by 60 gives $16.67 per order. Dividing by 50 gives $20 per new customer. Neither calculation changes the spend; the denominator changes the question.
A tracking error that sends a purchase event twice creates another problem. A platform may display more conversion events than genuine orders. That does not create extra customers or revenue. Reconcile unique order records with the tracking setup before treating the cheaper event-based cost as an acquisition improvement.
Shopify's customer-report documentation distinguishes first-time and returning customers and explains cohort reporting. Read the specific report definition. Some customer views use the customer's wider order history, so a label can reflect activity beyond the selected acquisition period.
A blended ROAS can hide the acquisition problem
Consider a separate chosen campaign summary. Advertising spend is $1,000. The report credits $2,000 sales from new customers and $2,000 from existing customers. Blended revenue ROAS is 4×.
If the task is evaluating new-customer acquisition, the $4,000 numerator combines two different groups. You cannot call the entire $4,000 first-order revenue from new customers. Nor can you assign all the spend to acquisition without deciding how the campaign and costs are classified.
The right allocation is not established by this example. You need the campaign setup, customer records and a documented cost basis. A mixed campaign may be useful, but its overall revenue multiple does not automatically measure the efficiency of acquiring new people.
Google's customer lifecycle documentation describes different acquisition and retention goals. That product distinction is useful context, not proof that a setting perfectly identifies every customer or produces profitable acquisition. Keep the business reconciliation separate from the advertising platform's optimization objective.
Build the contribution behind the first-order allowance
The original example chooses $18 contribution before acquisition. To apply the method to your store, calculate that amount from matched first orders: product revenue after the relevant discounts and refunds, product cost, fulfillment, actual fees and other included variable costs.
Keep the acquisition cost out of that subtotal until the final comparison, otherwise you subtract it twice. If creative or agency costs are allocated later as part of a fuller CAC, do not also hide them inside a per-order operating-cost field without a clear adjustment.
A chosen cohort could contain fifty first orders, with $4,000 product revenue and $3,100 named non-acquisition costs. That leaves $900, or $18 per new customer. Subtract the $1,000 ad spend and the cohort is negative $100, matching the earlier example.
This gives a first-order ad-spend allowance of $900 at zero contribution after ads, or less if you want a positive target. If you want $250 left from the cohort, the allowance is $650, or $13 per new customer. This is a cost budget, not a claim that the ad platform can deliver customers at that price.
Repeat contribution needs its own evidence
The first-order gap can be covered by later contribution only if those later purchases actually occur and leave money after their own costs. Revenue alone is not enough.
Return to the fuller $30 CAC and $18 first-order contribution. The initial gap is $12 per acquired customer. If a repeat order leaves $15 after its named product, fulfillment, payment and retention costs, the cohort needs an average of 0.8 such repeat orders per acquired customer to cover that gap. Across fifty customers, that is forty repeat orders under these chosen assumptions.
That does not mean eighty percent of customers must repeat exactly once. Some may never return while others buy several times. It also does not mean forty future orders are likely. It is the conditional amount of later contribution needed to repay the initial deficit.
If each repeat order leaves only $6 instead, the cohort needs two repeat orders per acquired customer on average. If repeat orders cost money after retention spending, they do not repair the first-order gap. A lifetime-revenue headline can conceal all three situations.
Time changes the risk even when the total matches
Earning the required repeat contribution next month differs from earning it over two years. The business needs to fund stock, ads and operating commitments while waiting. Some customers may stop buying before the projected value arrives.
Record a common follow-up horizon for each cohort. Compare thirty-day contribution with thirty-day contribution, not a mature year's customers with people acquired last week. Mark cohorts that have not had time to complete the window.
If the decision depends on a longer forecast, show the retention, order frequency, contribution and timing assumptions separately. Do not label the forecast as observed lifetime value. Consider a more conservative case and what happens if payback arrives later than expected.
Our cash-flow guide makes the dated funding question explicit. A business can have a plausible long-run customer model and still be unable to fund the near-term acquisition plan safely.
Average CAC does not price the next customer
The historical average divides a past cost pool by a past customer count. It does not prove that the next spending increment will acquire customers at the same cost.
Suppose the first $1,000 brings fifty new customers, an ad-only $20 each. A further $500 brings only ten more under a chosen scenario. The additional customers cost $50 each, while the combined average becomes $1,500 divided by sixty, or $25.
A blended $25 can hide the expensive increment. If the first-order allowance is $18 and later contribution is uncertain, the extra spend needs its own review. This does not establish that acquisition costs always rise with spending; it shows why the marginal question differs from the historical average.
Keep test increments and periods visible, and account for delayed conversions before making a final comparison. A small batch can be noisy. Do not claim that an apparent change in the average proves a stable response curve.
Write a customer-cohort review you can reproduce
Start with the acquisition period, customer definition, included channels and cost basis. Record first-order product revenue, matched reversals, named operating costs and the count of genuine new customers. Save the source exports in your controlled systems.
Then show the calculation in layers: ad-only acquisition cost, any additional allocated acquisition cost, first-order contribution and later observed contribution at fixed ages. Keep forecast values in separate columns.
Inspect different products or channels where the counts support a useful comparison. A blended improvement might come from a shift toward an easier audience rather than a better campaign. Conversely, a new channel may look weaker early because its cohort has less follow-up time. The reporting needs to distinguish those explanations before the budget decision.
Protect customer data during this process. A public calculator needs aggregate amounts, not names, emails, addresses or account credentials. If someone helps review the model, share the minimum non-sensitive totals and definitions required to reproduce it.
Choose the next action from the actual weak point
If tracking duplicates events, fix tracking. If contribution is weak before acquisition, review pricing, costs or the offer. If new-customer classification is unclear, reconcile customer history. If payback depends on unobserved repeat purchases, gather mature cohort evidence before treating that forecast as spendable value.
A stronger ROAS is not a universal remedy for these different problems. The useful decision names the cohort, the cost allowance, the observed contribution and the uncertainty in what comes next.
Start with your own cost scenario and keep the customer denominator separate from the order denominator. That makes the result useful for a professional budget decision without pretending a single green multiple knows the future.
Keep refunds and identification changes visible
A customer's first order can later be fully refunded. Decide how that event is treated in the acquisition report and keep the rule consistent. Removing the revenue while leaving the acquisition cost is economically important, but the customer identity may still exist. Do not silently redefine “new customer” in the next report to make the denominator more favorable.
Customer identification can also change. Guest checkout, merged profiles, changed email addresses and different devices can complicate deduplication. Use the capabilities and limits of the source system; do not promise perfect person-level recognition from an aggregate campaign report.
Write the classification rule down. If a correction changes the number of new customers, revise the affected cohort and retain a note explaining the difference. Otherwise a historical CAC improvement may be a data-cleaning change rather than a marketing improvement.
Understand what the calculator cannot certify
A correctly calculated cost per customer cannot establish that the campaign caused those customers to buy. Attribution assigns credit under rules. Incrementality asks what would have happened without the advertising. Those require different evidence.
A controlled experiment can help answer the causal question where the setup and scale allow it. An ordinary dashboard export alone cannot. If you lack that evidence, describe the result as an attributed or allocated acquisition calculation rather than verified incremental return.
Likewise, a contribution budget is not a bidding instruction. Auction behavior, conversion delays, customer classification and campaign settings affect execution. Use the budget as a constraint to investigate, not a guarantee that a chosen target will be achieved.
The clearest report keeps these boundaries in view while still doing the practical arithmetic. You can know what the observed cohort cost and contributed without pretending to know every counterfactual purchase or future repeat order.
Customer acquisition cost formula: count new customers, not orders
Customer acquisition cost divides the acquisition spending you include by the new customers acquired on the same basis. In an arithmetic example, $1,000 of stated acquisition spend and 20 new customers gives a $50 CAC. If those customers place 30 orders, dividing by 30 produces cost per order, a different measure. State whether creative, agency fees and staff costs are included in the spending total.
Return on ad spend divides attributed revenue by ad spend. ROI uses a defined profit or return measure relative to an investment. A 4× ROAS therefore does not establish a positive ROI, and neither tells you CAC without a new-customer count. Keep attribution windows and refund treatment consistent before making the comparison.
The practical question is what a new customer leaves after the costs you can substantiate. Do not justify a first-order loss with an assumed lifetime value unless your own matched customer history supports the repeat purchases and costs behind it.