
Slow stock needs a plan. A discount alone is not one. Before you lower a price, check how much each sale leaves, how many extra units you need to sell and whether you even have enough stock to cover that target.
Use the free inventory markdown calculator to test your own figures. It works in your browser. There is no store connection, upload or automatic price change.
Why 20% off can cost half your margin
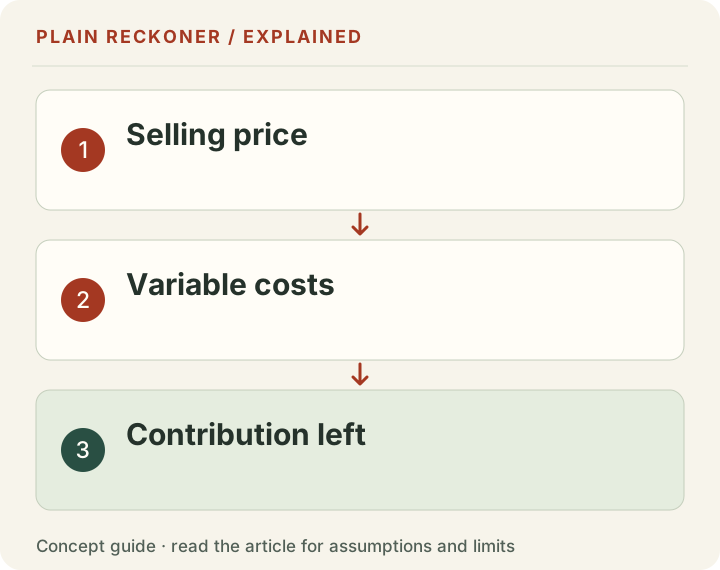
Here is a worked example, not measured store performance. An item sells for $40 and costs $24. For this first calculation, there are no other costs or fees.
| Per unit | Full price | 20% off |
|---|---|---|
| Selling price | $40 | $32 |
| Product cost | $24 | $24 |
| Contribution left | $16 | $8 |
The price falls by $8. The contribution also falls by $8. But $8 is half the original $16 contribution.
If you normally sell 20 units in the comparison period, those sales leave $320 before other costs. At the sale price, you need 40 units to leave the same $320. That is 100% more units, not 20% more.
This is a target. It does not mean a 20% discount will produce those extra buyers.
Add the costs that change the answer
Now include a 3% selling fee and $2 of other selling costs per unit. Put $50 into promoting the sale. Keep the same price, product cost and 20-unit baseline.
- Full-price contribution per unit: $40 × 97% − $24 − $2 = $12.80.
- Discounted contribution per unit: $32 × 97% − $24 − $2 = $5.04.
- Baseline contribution: 20 × $12.80 = $256.
- Sales needed after the discount: round up (($256 + $50) ÷ $5.04) = 61 units.
You need 41 more units than the baseline. Selling 60 leaves $252.40 after campaign cost, which misses the $256 target. Selling 61 leaves $257.44, which clears it.
The $5.04 is contribution after the entered product and selling costs. It is not net profit. Tax, returns, overhead and costs you did not enter remain outside this calculation.
Check stock before chasing more sales
Suppose you only have 30 units left. A 61-unit target cannot be reached from those units, even if every one sells.
That does not automatically make a clearance sale wrong. You may need cash, space or an end to storage costs. But it changes the question: are you trying to preserve contribution, release cash or clear space? These goals can lead to different choices.
Our tool keeps cash recovered separate from contribution. If the stock was paid for earlier, cash from selling it can be positive even when the price does not cover its full product cost. That still does not make the sale profitable.
Use your latest figures, with matching dates
Start with one product or variant. Gather its current price, landed product cost, units available, completed units sold and days it was in stock. Add fees, packing, shipping you pay and the proposed campaign budget.
Use in-stock days when estimating the observed sales pace. Ten sales over ten available days are different from ten sales over a month when the item was unavailable for most of it. Check how your own platform defines the field; do not silently substitute calendar days.
Shopify's inventory reports include sales pace, sell-through and remaining-inventory measures. A remaining-days value is unavailable when there are no sales; it is not proof the stock will never sell. Use these reports as inputs, then check the cost of your proposed action.
Recent does not mean instant. Shopify's product analytics describes a recent 30-day window with a usual processing delay. Google Merchant Center's Popular products updates weekly and says new data may take up to two weeks to appear. Check the observation period as well as the day you opened a report.
What we measured—and why it cannot pick your discount
We analyzed 541,909 historical invoice lines in UCI's Online Retail dataset, credited to Daqing Chen. The records come from one UK retailer in 2010–2011 and include wholesale customers.
After the stated filters, 525,783 positive invoice lines remain across 3,789 merchandise-shaped product codes. The top 379 codes by calculated gross invoice value account for about 61.30% of that value. The data page publishes the filters, counts, aggregate download and source checksum.
This shows how uneven one historical product mix was. It does not tell us which item in your store is slow today. The source has no product costs, stock-on-hand or reliable promotion labels. We cannot use it to claim a discount caused demand, improved profit or cleared dead stock.
That is why this tool starts with your figures rather than presenting an old sample as a live price recommendation.
Compare a few options before changing every price
Run the same costs and time window at 0%, 10%, 20% and your proposed discount. For each option, check contribution per unit, the whole-unit recovery target and the stock constraint.
If the target looks unrealistic, consider a smaller discount or campaign budget. Bundles, a different sales channel, supplier returns or holding the item may also deserve a separate cost comparison. None is automatically better.
Shopify Smart Pricing offers forecasting for eligible products using store history. Our calculator does something narrower: it shows the conditional arithmetic without a forecast, connection or purchase-history threshold. It cannot replace a demand test.
Your next step
Open the inventory markdown test, replace the example and compare the target with your actual stock and recent pace. If you test a promotion, record its dates, traffic, units, price, fees, returns and campaign spend. A simple before-and-after comparison can still be affected by seasonality and other changes.
Need help checking those assumptions? Request a free manual review. Share the question and non-sensitive totals; do not send customer records, store passwords or payment details.
A current reporting change: on-hand does not mean ready to sell
Before entering available units, check the inventory state in your report. This became particularly important in Shopify's October 2026 reporting change.
Its inventory-report documentation says that, from 1 October 2026, inventory-based reporting uses On hand quantity instead of Available quantity. Earlier history remains on the old basis. On-hand stock can include committed units and unavailable units as well as units customers can buy.
That can create an apparent inventory increase across the change even when no delivery arrived. It can also make a promotion target look possible if the input includes units reserved for existing orders, damaged items or other stock you cannot sell now.
For a chosen example, suppose a report shows 70 units on hand. Of those, 20 are committed and ten are unavailable. Only 40 are currently available for new sales. The earlier 61-unit recovery target cannot be met from those 40 sellable units. Entering all 70 would hide that constraint.
This is not evidence that Shopify lost or created stock. It is a definition change you must reconcile. Compare the inventory states and dates before interpreting a step in the series as a business event. Use the count available to the proposed promotion, not the largest stock total displayed.
Sales rank is not a profit rank
A product can be a small share of store revenue and still serve a useful role. It might complete a bundle, draw repeat customers or meet a specific need. Those benefits need evidence, but they should not be ruled out merely because the item sits in a low-revenue category.
Shopify's ABC analysis documentation describes categories based on revenue contribution. It also states that the grading calculation excludes discounts and does not use item costs. An ABC grade therefore does not establish the contribution left after a discount, delivery or advertising.
Use the grade to decide what deserves investigation, then calculate the economics. An A-grade product may tie up considerable cash or have a narrow contribution. A C-grade product may sell slowly but have low carrying costs. The classification is a starting point, not a command to discount.
Our historical UCI calculation has the same limit in another form. A concentration of gross invoice value is not a concentration of profit. Without product costs, stock availability and promotion labels, the records cannot identify the best clearance decision. Large row counts do not supply fields the source never recorded.
Compare the cash choice with the contribution choice
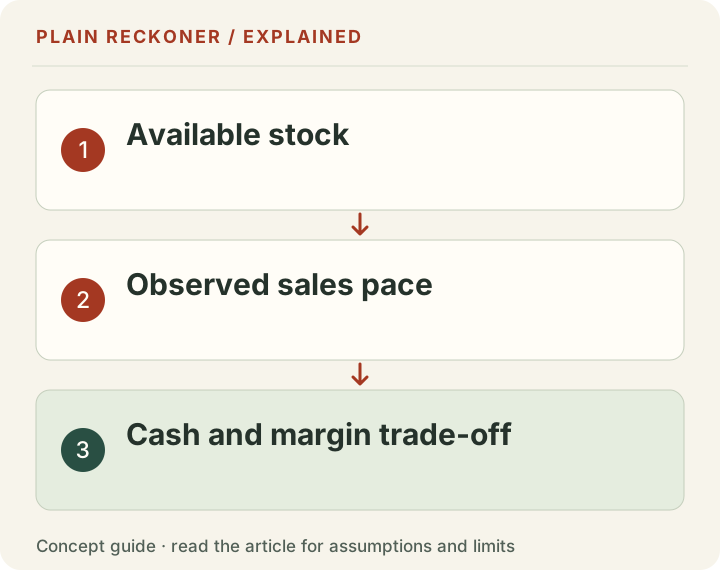
Clearance is sometimes a cash decision. Suppose you already paid for the stock. Selling a unit brings a new customer receipt, while the original purchase payment happened earlier. That timing can help fund current bills even if the sale fails to recover the full historical cost.
Still, record both views. Contribution asks whether the revenue covers the named costs assigned to the sale. Cash recovery asks what money the action brings in now and what new cash costs it causes. A positive receipt is not proof of profit.
Compare selling now with realistic alternatives. Holding stock may create storage charges, damage risk or a later disposal cost. Returning it to a supplier may involve a restocking fee and a credit rather than cash. Another sales channel may bring a different fee and fulfillment bill. A bundle may move units but reduce contribution on the products that would otherwise have sold alone.
Put dates beside these alternatives. Receiving a small amount next week is different from receiving a larger uncertain amount months later. This guide does not estimate the right discount rate or tell you which cash constraint matters most. It helps separate the questions so you can assess them with your actual records.
Estimate the pace without calling it a forecast
If you sold ten units during twenty in-stock days, the observed pace is half a unit per in-stock day. Forty remaining sellable units represent eighty such days at that unchanged pace. That is a conditional coverage calculation, not a claim that the next eighty days will behave like the last twenty.
Now suppose the product was actually available for only five of those twenty calendar days. Using calendar days would report half a unit per day; using those five available days gives two units per available day. Neither input should be guessed. Confirm what the source report counts and whether stock availability was recorded reliably.
Seasonal products, new launches and recently changed prices need particular care. A quiet period may not represent the next holiday week. A promotion may pull forward purchases that would have happened later. A stockout can hide demand rather than prove it was weak.
For that reason, keep observed pace, assumed promotion pace and the recovery target separate. One describes the past, one is a scenario and one is the minimum required by the contribution calculation. Putting them in different fields prevents a target from quietly turning into a forecast.
Design a promotion you can learn from
Write a short test plan before changing the price. Name the product or variants, starting stock, full price, proposed price, dates, placement, campaign spend and the costs included. Record what decision you will make after complete orders and likely returns have been reviewed.
Keep the baseline honest. If the old price sold during a quiet week and the promotion runs during a major holiday, the difference cannot all be credited to the discount. If you change the images, audience, shipping offer and price together, you are testing a package of changes rather than price alone.
A carefully assigned comparison group can improve causal evidence where practical, but ordinary small-store tests often lack the volume or setup for a clean experiment. In that case, report the observations and limitations plainly. Do not turn a before-and-after change into a precise estimate of price elasticity.
Track contribution across the matched orders, not only units. A promotion that sells more while returning more items or consuming a larger ad budget can miss its purpose. Include the cost of returned goods, retained fees and recovery into stock where applicable. Let enough time pass to see the relevant reversals rather than declaring success on checkout day.
Set a stop rule before the sale starts
A useful stop rule is tied to the decision. You might stop paid promotion when spending reaches the planned cap, when the available stock reaches a reserve for existing customers or when the observed cost per order leaves too little contribution. Choose the rule from your economics rather than copy another store's threshold.
Also decide what happens to unsold units afterward. Repeating the same sale indefinitely can turn an intended test into the permanent price. Check whether a second markdown still leaves positive contribution and whether the extra units needed remain physically available.
Keep the final review short: units sold, sales after discounts and matched refunds, named costs, contribution, cash received and stock left. Explain any important changes in traffic or availability. The best result is a clearer next decision, even when the promotion did not meet the original target.
Protect customer information while keeping that record. Product codes, aggregated order counts and cost totals are normally enough for the calculation. Customer names, card details and private account tokens do not improve the arithmetic. Keep the raw operational export in your own controlled system, and share only the minimum needed if asking someone to check the model.
Finally, preserve the original prices and source dates. Comparing a later result with a baseline you have overwritten makes the lesson difficult to verify. A simple dated worksheet is more useful than a confident claim that the discount “worked” without the underlying totals.
Slow-moving inventory analysis starts with a stated time window
There is no universal stock-age cutoff that makes every product slow-moving. A seasonal item and a frequently reordered consumable have different buying patterns. Choose the period and definition before reviewing the list: days since the last sale, units sold in the period, stock age or weeks of cover. Keep the measure visible beside the result.
A simple weeks-of-cover calculation is units on hand divided by average weekly units sold. In an arithmetic example, 120 units on hand and 10 sold per week gives 12 weeks of cover. If recent sales are zero, the ratio has no finite result. Show ‘no sales in the chosen window’ instead of treating it as zero weeks or inventing future demand.
To identify slow-moving inventory worth discounting, also check the sale contribution, holding costs, shelf life and next realistic selling season. Use the markdown tool to compare the proceeds under explicit inputs. A stock-age flag is a reason to investigate, not an automatic instruction to reduce every price.