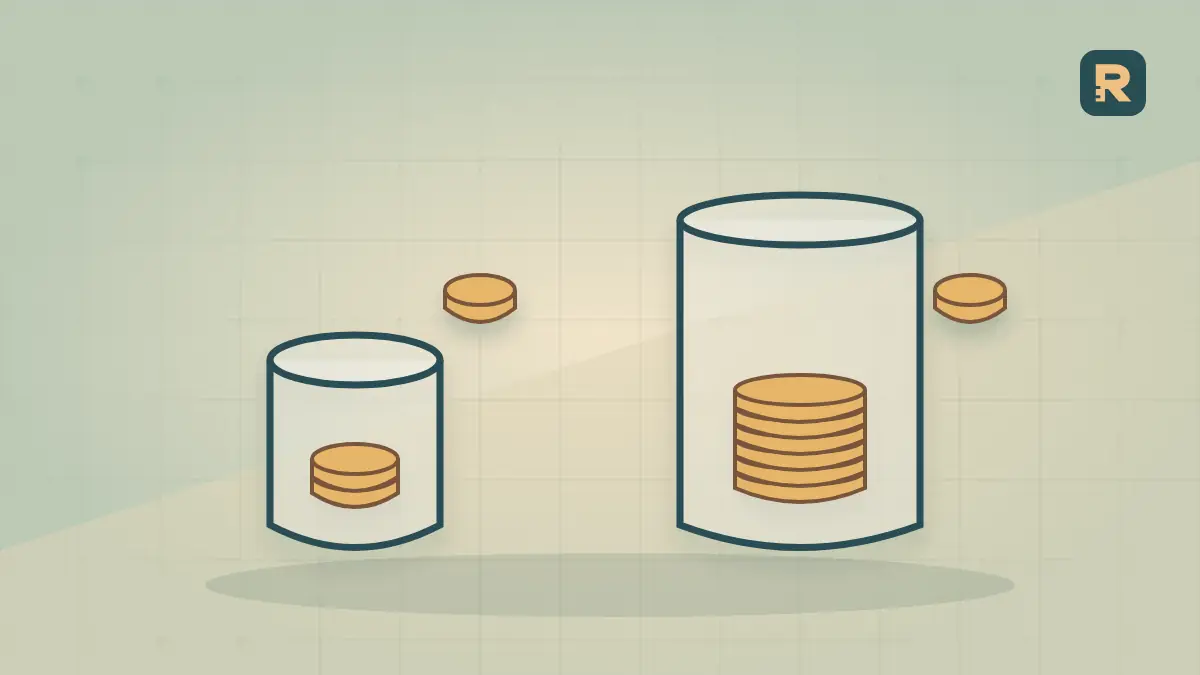
A 3% fee plus $0.30 is not a 3% cost. The fixed part takes a larger share of a small payment. If your store sells low-priced products, that difference can matter more than a rounded dashboard percentage suggests.
Payment schedules vary by country, card, payment method, currency and agreement. Inspect a current provider pricing page and your own statement. This guide uses a chosen 3% plus $0.30 example. It is not a universal rate or a recommendation of one processor.
Calculate the effective fee
The fee is the percentage multiplied by the payment amount, plus the fixed charge. Divide that total by the payment amount to get the effective rate.
Swipe or scroll the table horizontally to see every column.
| Payment amount | Percentage part | Fixed part | Total fee | Effective rate |
|---|---|---|---|---|
| $10 | $0.30 | $0.30 | $0.60 | 6.00% |
| $20 | $0.60 | $0.30 | $0.90 | 4.50% |
| $50 | $1.50 | $0.30 | $1.80 | 3.60% |
| $100 | $3.00 | $0.30 | $3.30 | 3.30% |
At $20, calling the fee 3% misses $0.30. Across 1,000 such payments, that omitted fixed charge is $300. This is arithmetic under the stated schedule, not a measured industry loss.
A checkout story worth separating from a profit claim
On 5 October 2026, Shopify announced faster checkout and carts that sync across devices through Shop. Its announcement describes returning shoppers being recognized earlier, a pre-filled payment button and carts that follow a shopper between devices. Those are changes to the buying experience. They do not tell us what a particular merchant keeps from the resulting orders.
That distinction matters when a store owner reads a launch story. A checkout can become easier while an individual offer remains unprofitable. More completed payments bring more product costs, fulfillment work and payment fees as well as more revenue. Before celebrating an increase in orders, compare the money left on comparable orders. The provider announcement does not supply an independent profit experiment for your store, and we have not run one on its behalf.
Here is the practical connection to this guide: if a checkout change brings more small orders, the fixed charge matters more often. If it encourages shoppers to complete larger baskets, the fixed charge may become a smaller percentage of each payment. Neither direction can be inferred from the launch itself. Look at your own distribution of payment sizes, not a single average basket figure, and compare complete periods with the same fee rules.
A real business story gives us a useful question to investigate. It does not give us permission to invent a customer's results. Keep the announcement date, the provider's stated feature and your measured outcome in separate columns when you write an internal review. That makes it much easier to revisit the decision when fees or checkout behavior change again.
Check the amount the percentage applies to
Does the provider charge on product revenue alone, or on the full payment including delivery and tax? Are there additional cross-border, currency-conversion or platform fees? Read the actual schedule and compare it with a completed transaction.
A product-margin report may exclude costs that the processor charges on a wider payment base. Enter actual total fees in the order profit calculator. That is safer than assuming the advertised percentage captures every charge. Keep the product revenue, shipping receipts and matched refunds separate.
For zero-value payments, an effective rate has no useful denominator. For very small payments, minimum fees or method-specific rules may replace this simple formula. Do not extend the example beyond the fee schedule it assumes.
Follow one low-priced order all the way through
Consider a worked example of a $20 product payment. The product costs $8, packing and delivery cost $4, and the customer pays no separate delivery charge. The chosen processing schedule is 3% plus $0.30. There is no sales tax, currency conversion, platform fee or return in this first example. Advertising costs $5 to bring in the order.
The payment fee is $0.90. Before advertising, the order leaves $20 minus $8 minus $4 minus $0.90, or $7.10. After the $5 advertising cost, contribution is $2.10. This is contribution from the listed costs, not accounting profit: rent, software, wages, owner pay and other unentered costs remain outside the example.
If a spreadsheet includes only the 3% percentage fee, it reports $2.40 after advertising. That is $0.30 more than the actual contribution under our assumptions. The missing charge looks small next to revenue, but it equals about 14.29% of the correct $2.10 contribution. A small error in revenue terms can be a meaningful error in the amount available to pay overhead.
Now imagine the shop offers a $2 discount to increase sales. Product cost, delivery and ad cost stay the same in this simple sensitivity test. The payment becomes $18 and the fee becomes $0.84. Contribution falls to $0.16. The discount reduced contribution by $1.94, because the percentage fee also fell by $0.06. A discount that sounds modest can consume nearly all the room in a low-priced order.
Those figures are chosen to show the mechanism. They are not an average store, a customer case study or a reason to avoid discounts in every business. The useful lesson is to calculate the whole order before choosing the offer.
Use a comparison that holds the other costs still
Suppose you want to know whether a different payment schedule helps. At the same $20 payment, compare the original 3% plus $0.30 with a hypothetical 2.8% plus $0.40. The second schedule has a lower percentage, but its fee is $0.96 rather than $0.90. At $100, it would cost $3.20 rather than $3.30. The winner changes with the payment size.
You can find the crossover without guessing. Set the two fees equal: 0.03 times the payment plus $0.30 equals 0.028 times the payment plus $0.40. The difference in percentage charges must cover the ten-cent difference in fixed charges. At a $50 payment, both schedules cost $1.80. Below that amount the original schedule is cheaper; above it the second is cheaper, under these assumptions.
Do not turn that arithmetic into a provider recommendation. The two schedules here are hypothetical. Actual agreements can include minimum charges, different payment methods, foreign-card fees, subscriptions and negotiated conditions. A switch can also change checkout behavior, settlement timing and staff work. Start with a matched fee comparison, then check those separate operational questions.
For a real review, use the same set of payments under both schedules. Applying one schedule to last month's small orders and the other to this month's larger orders mixes a pricing change with a customer-mix change. You would no longer know which change produced the difference.
Why the overall average can hide the problem
A store with many inexpensive purchases and a few large purchases can have a healthy-looking average basket. That does not mean every product can support the same advertising cost. Group payments by a small number of practical size bands and compare the fee share in each band. Use bands that match the products you sell rather than copying arbitrary industry cutoffs.
There are also two different averages. Total fees divided by total charged value gives a value-weighted effective rate. Averaging each payment's percentage gives every payment equal weight. Both can be calculated correctly while answering different questions. The weighted rate is useful for reconciling the total statement; the payment-level view helps explain what happens to small baskets.
For example, our $20 and $100 payments produce $4.20 of fees on $120 of charged value, a 3.50% combined effective rate. Their individual rates are 4.50% and 3.30%; a simple average is 3.90%. Neither number is a calculation error. The smaller payment receives more weight in the simple average than it does in the total-value calculation.
Label the method whenever you show the number. Otherwise two people can debate which dashboard is correct when the real issue is that they are comparing different averages. Use actual statement totals to check the weighted result before using either view for a product decision.
A larger basket is not automatically better
Combining two purchases can reduce the number of fixed transaction charges. But a bundle discount, a heavier parcel or an additional ad cost may cost more than the fee saved.
Two $20 payments at the example rate cost $1.80 in total. One $40 payment costs $1.50, saving $0.30 in payment fees. If the bundle requires a $2 discount, fee savings alone do not cover that discount. Product cost is unchanged in this comparison; delivery and other costs still need checking.
Use the bundle pricing calculator for the whole offer, and read the margin versus markup guide if the percentages in your reports use different denominators. A fee percentage and a product markup are not interchangeable.
A refund is a new event, not an erased payment
A refunded sale does not necessarily reverse every original payment fee. Provider and payment-method rules differ. Match a refund to the original transaction and read the fee entries rather than assuming the full charge was returned. Our return-cost scenarios let you choose how much of the original fee is recovered.
Keep the original fee, any recovered fee and extra return costs separate. Otherwise an order can disappear from net sales while its processing cost remains hidden in another report.
Stripe's explanation of refunded-payment fees states that original processing, Connect and currency-conversion fees are not returned; additional refund conditions depend on the pricing agreement. Shopify Payments' refund documentation likewise explains that the original credit-card processing charge is not reimbursed. These are provider rules, not our measurement of every payment service. Check your current agreement and payment method.
Return to the $20 example. If the customer receives a full refund and the $0.90 original processing fee remains, net product revenue is zero while that fee still exists. If the product can be resold, recovered stock is an asset you may use later; it is not money received from the customer today. Original delivery, the ad cost and any return handling also need their own entries.
For a partial refund, do not assume the retained fee shrinks in the same proportion as net sales. Read the actual balance entries. A report that subtracts refunds from sales and then applies a headline fee percentage to the remaining sales can understate fees when the original charges remain in place.
This is why our tools keep matched refunds, recovered product cost and extra return handling separate. Entering an unexplained net figure can hide an important assumption. A clear cost bridge makes it possible for someone else to check the result without trusting a single opaque score.
Review a statement without uploading customer data
Choose several real transactions with different basket sizes. Record the charged amount, total fees, currency and method. Recalculate each effective rate. Explain differences using the schedule before calling them an error.
Then repeat the contribution calculation for the products you actually sell. The useful question is what remains after the costs, not which headline percentage is smallest. If you request a manual review, remove payment credentials and customer details; a few anonymized totals and the relevant fee terms are enough to start.
Start with a small local worksheet. Give each transaction an anonymous reference. Record its charged amount, currency, payment method, original fee, refunded amount and any fee returned. Keep names, email addresses, full card details, access tokens and bank information out of the worksheet you share. You do not need those details to test this calculation.
Choose transactions that cover the situations you actually face: small and large baskets, a domestic payment, any cross-border payment and a refund if one exists. This is a diagnostic sample, not a representative estimate of the entire business. To measure total monthly cost, use the complete matched statement rather than projecting from a few hand-picked transactions.
Next, reconcile the totals. Payment volume is not necessarily product revenue. It can include shipping receipts and tax collected. A payout is not necessarily revenue either: payout timing, reserves, refunds and deductions can change the cash reaching the bank. Ask what each report includes before dividing one number by another.
When an entry differs from the advertised rate, check the agreement and transaction attributes first. Do not immediately call it an overcharge. When the discrepancy remains unexplained, keep the anonymous reference and calculation and ask the provider for the applicable fee rule. That gives support a specific, reproducible question.
Turn the calculation into a decision you can test
Choose one change at a time. You might compare a two-item bundle, a different free-delivery threshold or a change in advertising spend. Save the starting costs in the order profit tool before changing the inputs. The saved comparison tells you which assumptions changed and how the calculated contribution moved.
Set a decision rule before you look at the outcome. For instance, a bundle must leave more contribution per completed order while using stock you can replenish. Then check the other side: did the bundle reduce the number of customers buying, increase parcel cost or create more returns? A better result per order does not guarantee a better result for the whole month.
Use a complete reporting window and keep any unobserved outcomes explicit. Returns often arrive later than purchases. A seven-day snapshot can look better simply because the refunds have not happened yet. Compare cohorts after an appropriate return window, or state clearly that the recent cohort remains incomplete.
Finally, decide whether the potential saving is large enough to justify the work. Saving $0.30 on an occasional order is different from saving it across a large volume of otherwise identical payments. Implementation, support and checkout friction can cost more than the modeled fee difference. The calculator helps structure the decision; it cannot observe those costs for you.
Questions to answer before changing anything
Should I raise my minimum order value? Calculate the contribution change and check the effect on buyers. A minimum may reduce loss-making orders, but it may also turn away buyers who would have purchased profitably. There is no universal minimum that follows from a processing fee alone.
Should I add a payment surcharge? This guide does not determine whether you may do that. Rules vary by jurisdiction, card network, agreement and payment method. Check the applicable requirements before changing checkout pricing. A mathematical saving is not legal permission, and transparent customer pricing still matters.
Does a lower effective fee mean a healthier store? Only if the rest of the economics support that conclusion. A larger basket can lower the fee percentage while requiring a deeper discount or more expensive delivery. Contribution and cash timing deserve separate checks.
What should I send for a manual review? Send the question, the country and currency, the relevant fee terms and anonymized totals. Explain whether sales include tax and delivery, and whether refunds are matched to the same payments. Never send card details or account credentials. Clear inputs are more useful than a large file full of private records.
The next step is simple: pick one real order, reconcile its actual fee, and follow the remaining costs through to contribution. Once that single order makes sense, repeat the same method on the full group of orders you want to compare.