
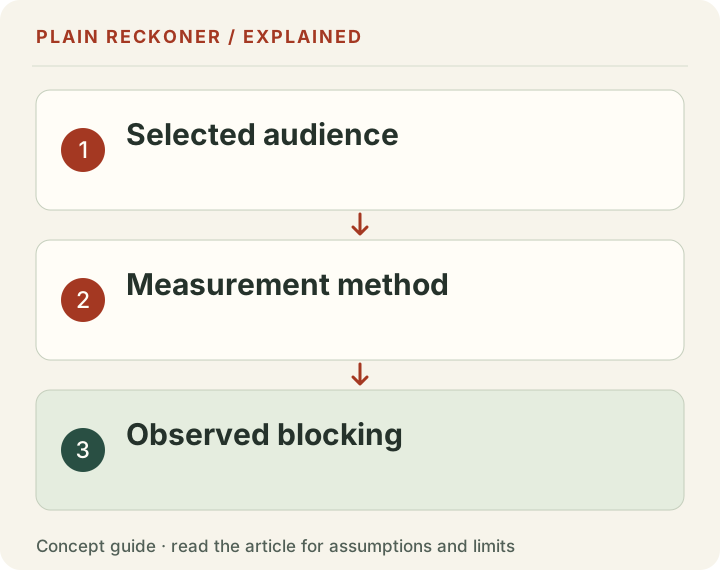
Different audiences and measurement methods can give different ad-blocking rates. Dividing one published percentage by another does not identify how accurately people report their behavior.
Read the Docs’ advertising documentation lists 32% of its users as using an ad blocker. That is a claim about that publisher’s audience. It is not a measurement of every developer or a newly collected 2026 rate.
Our previous article compared it with a 72.3% figure attributed to the raw Stack Overflow 2018 survey and described the result as a 2.3-times gap between what people said and did. That interpretation required the same population and comparable observations. We did not establish those conditions.
The population comes before the percentage
A developer survey samples respondents. A documentation platform observes its own audience and implementation. The same job category does not make those people interchangeable, and a person-level survey is not necessarily comparable with a visit- or impression-based detection rate.
Devices, browsers, geography, consent, detection methods and which visits can be observed can all change the result. A publisher may also serve advertising that some blocking configurations allow. A single percentage does not capture those conditions.
The Stack Overflow 2018 report is a historical survey. In this pass we did not rerun the raw-response calculation behind the previously cited 72.3%. It should therefore not be used here as verified evidence of current developer-wide blocking or a self-reporting error.
What a publisher should measure instead
Define the outcome you need: users with a detected blocker, pageviews without an ad request, eligible impressions, filled impressions or advertising revenue. Those are different denominators and cannot be silently substituted.
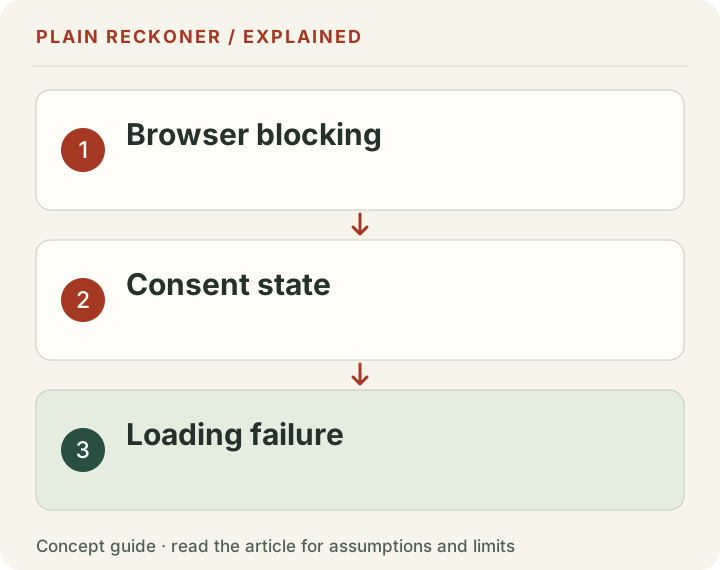
Record the observation window, implementation, consent treatment and detection limits. A failed advertising request may reflect a blocker, but it may also reflect a network failure or another configuration. A detection method needs validation before every missing request is counted as intentional blocking.
Compare repeated observations from the same site and method before borrowing a rate from another audience. Keep uncertainty visible when traffic is too small or the measurement misses some visits.
What we removed
The former claim that measured developer blocking must sit in a universal 25–33% band has been removed. Examples from several publishers do not define one occupation-wide rate. We also removed the assertion that no current figure exists anywhere; failing to identify a comparable public estimate is not proof of universal nonexistence.
For revenue planning, actual earnings and matching traffic are more useful than an assumed blocker rate from another site. The RPM tool calculates that relationship without inferring the reason an ad did or did not render. Our sampling explanation sets out why the audience definition matters.
Correction, 19 October 2026: the behavioral-gap and universal-rate conclusions have been withdrawn. The 32% remains attributed to its publisher and limited to its stated audience; this article does not present a new independent rate.
Ask which population the rate describes
A survey can ask whether a person uses an ad blocker on any device. A publisher can observe whether a particular page request produced a particular signal. Those questions can disagree without anyone answering dishonestly.
One respondent might block ads on a work laptop and allow them on a phone. That person could truthfully answer yes in a survey while generating both blocked and unblocked visits. Counting people once and counting visits repeatedly creates different weights even before considering sample recruitment.
A frequent visitor contributes more requests to a site-level traffic measure than someone who visits once. A survey that counts each respondent once does not give that person the same weight. The occupational label developer does not remove this difference.
Before comparing two published figures, write down the population, unit, recruitment or collection method and date for each. If those fields are missing, the figures can motivate a question, but they cannot establish a precise behavioral gap.
Draw the measurement chain before writing a detector
A useful chain begins with a visit eligible to view advertising. Then ask whether the page and relevant scripts loaded, whether consent permitted the intended activity, whether an ad request occurred and whether the response produced an impression under the provider's definition.
A failed step can have more than one cause. A script may be blocked by an extension, a browser feature, a network rule or a temporary failure. An ad may not be requested because the page does not place one in that context. A request can succeed without producing a filled impression.
Decide which stage the measurement actually observes. If the code watches one script load, call the outcome a script-load observation rather than a complete census of blocking behavior. If it uses a test element, explain what that element tests and what it cannot detect.
This level of detail may sound less impressive than an all-purpose blocker score. It is more useful for debugging, because the publisher can investigate the specific stage that changed instead of treating every missing event as a user's deliberate choice.
Unknown visits are part of the denominator problem
A detector implemented in JavaScript cannot necessarily observe every visit in which JavaScript fails to run. A report from the detector can therefore describe the visits it sees rather than all visits reaching the site.
Use chosen figures to make the distinction concrete. Suppose server-side records contain 10,000 eligible page responses after the researcher's documented filtering. The client detector reports on 7,000. Of those reports, 1,400 indicate its tested blocking condition.
The observed rate among reporting cases is 20%. It does not establish a 20% rate among all 10,000 responses. Three thousand cases did not report, and their behavior is unknown. The server count also needs its own checks for automated requests, caching, duplicates and the unit counted.
It may be possible to bound or investigate the unknown cases with additional evidence. It is not appropriate to assign them all to blocked or unblocked merely to produce one complete-looking percentage. Publish the reporting coverage alongside the detected rate.
Missing analytics is not identical to missing advertising
Read the Docs' documentation explicitly mentions several reasons why server hits may not register as Google Analytics pageviews. That is a valuable reminder that an analytics observation has its own collection path. It is not an independent ad impression count.
A visitor can block analytics while allowing an advertisement, or allow analytics while an ad request fails. A consent choice can affect one system differently from another. Differences in report definitions and timing add further reasons that totals may not match.
Mozilla's Enhanced Tracking Protection documentation describes browser protections and settings. Such protections provide another reason to inspect the actual implementation instead of assuming that an absent request identifies one extension or one user intention.
For a business review, keep analytics coverage and advertising coverage as separate questions. First establish what each report counts. Then compare the matched scope where possible. A gap between two totals is a clue to investigate, not a label explaining every missing visit.
A blocker user may still see some ads
The Read the Docs page discusses acceptable-ad and publisher-specific allow-list options. Its reported blocking audience is therefore not necessarily an audience from which every advertisement is excluded.
That matters when estimating commercial consequences. A survey response about using blocking software does not establish that the person blocked this publisher's actual placements. An extension can be installed without applying the same rules to every website or ad format.
Do not convert the historical 32% statement into a 32% revenue-loss assumption. The relevant counterfactual is the revenue that would have been earned under a different permitted experience for those visits. That requires more information than an installation or detection rate.
This is also a reason not to describe users as exaggerating or withholding revenue on the basis of two unmatched sources. A more useful question is whether the page's advertising experience is acceptable, understandable and compatible with the visitor's chosen privacy settings.
Calculate a revenue scenario with visible assumptions
Suppose a chosen example has 100,000 pageviews and $1,000 measured advertising revenue. Its observed page RPM is $10. That is the relationship between the recorded totals, not an explanation of why particular visits did or did not produce revenue.
Now imagine the publisher identifies 10,000 additional eligible pageviews that currently produce no ad revenue and can responsibly test a change. If those views earned a chosen $5 RPM after the change, the scenario would add $50. At $10 RPM it would add $100. These are scenario inputs, not predictions or a promise that a blocking-related intervention can recover the visits.
The calculation also assumes no offsetting effects. If the change causes users to leave, slows the tool or reduces returning visits, the net result can differ. Advertising that a visitor permits may not earn the same rate as existing inventory.
Use scenarios to understand what size of outcome would matter. Then compare actual matched revenue and user-experience evidence after a carefully defined test. Do not report the larger scenario as recovered income before it exists.
Validate the detector with a small controlled matrix
Test the implementation in known configurations: a normal supported browser, the same browser with a documented blocker configuration and the relevant consent states. Include JavaScript disabled, a simulated network failure and a page that intentionally does not request ads.
The purpose is to find false positives and false negatives. If the code calls a temporary request failure an ad blocker, the report's label needs revision or the detector needs improvement. If a known blocking configuration does not trigger it, document that limit rather than assuming all other users are unblocked.
Repeat the checks on mobile. Browser support, extensions and privacy features can differ, and a desktop-only result should not be advertised as all-device coverage. Save the detector version and the configuration used so later changes can be interpreted.
Avoid tests that ask people to weaken security or privacy settings as a condition of using a useful basic tool. A measurement project should respect user choices and collect only what it needs. The business question is whether an experience works, not how to force every visitor into a desired label.
Compare changes within a stable method
If a site's detected rate changes, first ask whether the method changed. A renamed test resource, a different consent setup or a release that delays scripts can affect the signal even if the underlying audience behaves the same way.
Keep a timeline of detector releases and reporting definitions. Compare windows with compatible methods, and annotate transitions. Do not join them into one smooth series without explaining a measurement break.
Check the traffic mix as well. More mobile visitors, a different country mix or a new referral source can change the overall rate. Split the report into useful groups only when there is enough evidence to interpret them, and preserve small or unknown groups without overconfident conclusions.
Our two-endpoint explanation applies here: two rates tell you the difference between endpoints, but not whether the path was gradual, sudden or caused by a reporting change. Keep intermediate observations when available.
Publish a result another publisher can understand
A useful result includes the measurement window, site or audience scope, tested condition, reporting coverage and known failure modes. Add the totals behind the percentage. A rate based on 20 reports and one based on 20,000 should not look equally settled merely because each is displayed to one decimal place.
Separate provider statements from independent reproduction. This article attributes the historical figure to Read the Docs; it does not claim to have rerun the publisher's detection system. The same standard should apply when a vendor supplies a number for a comparison table.
Explain what action follows. If the evidence suggests a script-loading problem, investigate that problem. If the advertising experience is intrusive, improve it. If the observation is too incomplete to distinguish causes, collect a better defined sample before making a revenue forecast.
For a publisher planning the business, observed revenue, eligible traffic and task completion are usually a stronger foundation than a borrowed occupation-wide blocking assumption. External figures provide context, while the site's own scoped measurements establish what happened there.
Ask better questions when commissioning a survey
If a survey is necessary, match its question to the intended decision. Ask about a defined period and device context rather than assuming that ever having installed software means blocking every current visit. Separate installation, active use and website-specific exceptions where respondents can reasonably answer.
Publish the question wording and response options. State whether the sample was recruited from one community and whether unanswered questions were excluded. A percentage among people who answered an optional question is not automatically the percentage among all respondents, much less all developers.
Do not overload respondents with technical distinctions they cannot observe. A person may know that they use a browser's privacy setting without knowing which requests it prevented on a particular page. A behavioral test and a survey can complement each other when each is described honestly.
The most useful comparison is not a contest over which percentage looks more authoritative. It is a documented explanation of what each method can observe and which remaining uncertainty matters to the publisher's decision. That makes the research usable without turning an old audience statistic into an unsupported claim about everyone.