
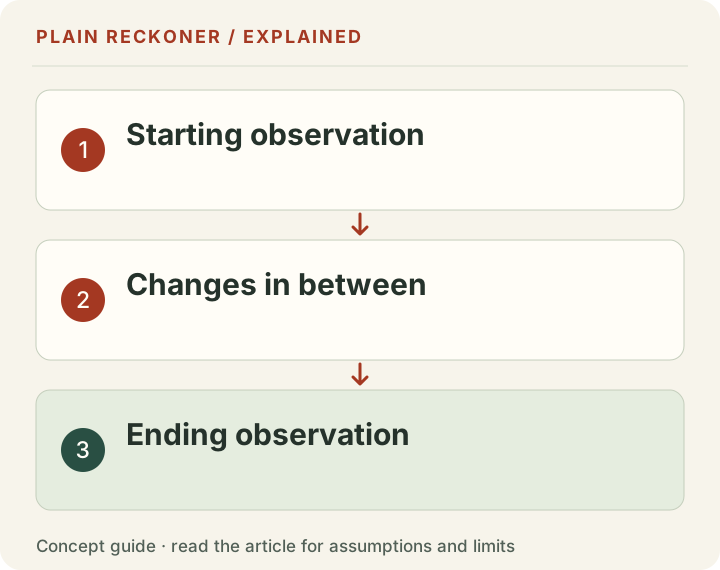
Two dates tell you the net difference, not how it happened. A measure can rise gradually, jump once, fall and recover or change definition between those dates. The same beginning and ending values can describe very different business situations.
Before calling the difference growth, inspect the available values in between and check what was counted. If the intermediate observations are unavailable, keep the endpoint comparison but state what it cannot reveal. An incomplete series is not permission to invent a smooth path.
Three historical investigations in this project illustrate the issue: a marketplace category with a sudden appearance in the records, a map query that omitted relevant representations and a vendor series whose intermediate values showed a jump. They are method examples, not a new measurement of those sources today.
The same endpoints can hide different paths
Consider chosen monthly values beginning at 100 and ending at 200. One series could increase by ten units each month. Another could stay near 100 until a single jump. A third could rise to 400 and then fall back to 200.
All three have the same endpoint doubling. Only the intermediate values reveal whether the final state followed a steady rise, a structural break or a retreat from a much higher peak. Calling each a sustained growth trend would erase a useful distinction.
A business decision can depend on that path. A temporary stock shortage, a sudden reporting migration and a stable increase in demand require different investigations. The endpoint arithmetic is not wrong; the interpretation may exceed what the two observations establish.
NIST's introduction to time-series analysis explains why time-ordered data can contain internal structure such as trend and seasonality. A chart is not merely a pair of totals connected by a persuasive line.
Historical case: a category begins appearing
The old marketplace review recorded a category sequence of zero values followed by positive counts, summarized as 0, 0, 0, 0, 0, 6, 16, 12. The topic was businesses labeled as earning through YouTube. A short endpoint comparison could have made that look like a new market appearing from nothing.
The safer observation is that positive category records began appearing in the available sequence. That can reflect actual activity, a new label, improved coverage, retrospective classification or a mixture. The sequence alone does not prove which explanation accounts for every case.
The earlier note stated that the broker began tagging the category in a specific year. Unless a documented classification history establishes that, the claim should remain a hypothesis to investigate. A first positive observation is not by itself the date the underlying business model began.
Keep categories and dates attached to records. If labels change, a historical comparison may need a consistent reclassification or an explicit break. Do not silently treat old missing labels as verified zero activity.
Historical case: the geography was not what the label said
A separate map-based project initially counted 101 records across three selected areas and interpreted the small count against a much larger expectation. The historical review then found two implementation problems: rectangles covered only parts of the intended regions, and the query selected points while relevant features could also be represented as outlines.
OpenStreetMap's element definitions distinguish nodes, ways and relations. That data model matters to a query. A point-only extraction is not a census of every relevant mapped feature simply because the output has a plausible table shape.
The old account reported a one-state recheck of 198 rather than 27. Those historical numbers demonstrate how large an implementation error can be in one inspected case. They do not establish the current count or a universal undercount factor for every region.
This is a related measurement lesson rather than a literal time-series result. Pulling more dates would not repair the geographic query. The general discipline is to inspect the intermediate construction steps before treating a surprising final number as a discovery.
Historical case: the values in between changed the story
The vendor-series review began with a reported change from 8.15% to 18.57% over roughly a year. The historical investigation then inspected thirteen monthly observations and found that a concentrated jump in the available sequence mattered to the interpretation.
A jump can be real. It can also coincide with an implementation, classification or coverage change. The observation alone does not prove that the vendor changed its method, and this article does not make that accusation.
The proper next step is to inspect the provider's definitions, release notes and source-period changes where available. If the explanation remains unknown, say the series contains a discontinuity whose cause has not been established. Do not choose a causal story merely because it makes the endpoint headline less interesting.
Our AI Overview study note now keeps the historical sample, date and category scope explicit. Reading a vendor table carefully is useful even when the result is a more limited statement than the original headline.
Preserve the observation date and the period represented
A value collected today may describe last month, last quarter or a rolling window. Record both the collection date and the period the source claims to represent. Otherwise, a series can compare different time concepts under one date label.
For example, a directory's current displayed count may be a snapshot, while a sales report may count completed events during a year. A rolling twelve-month total overlaps with the next month's rolling total. Those values should not be interpreted like independent monthly sales.
A source-check date is another field again. Reopening a historical report in October does not convert its old measurement into an October observation of the market. Keep freshness of review separate from freshness of data.
This distinction becomes especially important when publishing updates. A recently edited article can still discuss a historical dataset. State that plainly instead of allowing the modified date to imply a new collection.
Check definitions before plotting a line
Write the unit, population, inclusion rules and denominator for each period. A series of pageviews cannot be joined seamlessly to a series of users. A new classification that includes additional businesses can change a total without proving that the original group expanded.
The Overpass language reference illustrates how query choices define the result set in map research. In analytics, the equivalent choices concern event definitions, filters and reporting scope. In a marketplace, they concern category and status definitions.
Keep the original query or extraction version with the dataset. If a bug is discovered, document which values were affected and rerun the appropriate scope where possible. Do not update one endpoint while leaving the other based on the old incompatible query.
When the definitions cannot be reconciled, mark the break rather than smoothing it away. A visible discontinuity with an explanation is more honest than a continuous chart that implies comparability the data does not support.
Distinguish zeros, blanks and missing labels
A zero means the defined event or quantity was observed as zero under the stated method. A blank may mean it was not recorded, was unavailable or did not apply. A missing category label can mean the classification had not been used, not that no relevant activity occurred.
Do not turn every blank into zero to make a chart render. That can create a dramatic takeoff from nothing or an apparent collapse where the collection simply stopped. Preserve missingness in the table and show it explicitly in the visualization.
If the software requires a number for a calculation, stop that calculation or use a clearly labeled assumption. Do not hide an imputation. A reader should be able to distinguish observed values from values supplied by a model or by the researcher.
The same rule applies to a new business dashboard. An empty enquiry field should remain unknown until the user supplies a count. It should not become a zero that suggests the website failed to generate any interest.
A percentage change can conceal a changing denominator
Suppose chosen example A records ten relevant events from 100 eligible cases and later records twenty from 200. The event count doubled, but the rate remained 10%. A count headline and a rate headline answer different questions.
Now suppose the events stay at ten while eligible cases fall from 100 to fifty. The rate doubles to 20%, but the count has not increased. Depending on the business decision, either the rate, the count or both may matter.
Keep numerator and denominator alongside the percentage for each period. Check whether eligibility rules changed. A rate can move because the outcome changed, the population changed or the measurement changed; the percentage alone does not identify the reason.
Use the same caution with average position, RPM and other ratios. Aggregates can change because the mix of contributing cases changes. The session-versus-page RPM note shows why the denominator belongs in the label.
Look for seasonality without forcing a seasonal story
A comparison between January and December can reflect a calendar effect, but the dates alone do not prove it. Inspect previous comparable periods, the business context and the definition of the measure. A one-time event can occur during a familiar seasonal window.
If a year-over-year comparison is available, use it as additional context, not an automatic correction for every difference. Holidays move, products change and businesses enter different stages. A consistent calendar comparison helps but does not remove all confounding.
Keep measured seasonal evidence distinct from a chosen planning scenario. A historical ad-rate pattern can inform a stress test without predicting the next month's revenue. The scenario should state which parts are held constant and which are assumed to change.
A useful chart can show both the raw series and relevant annotations. Avoid a decorative trend line that hides the underlying observations, especially when the path is the very thing the investigation needs to understand.
Use release and business timelines as context
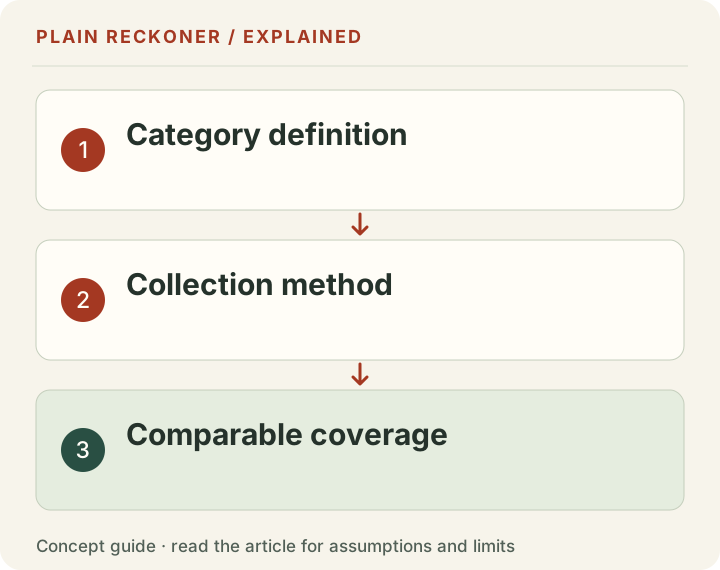
Record major product launches, tracking migrations, changes in eligibility and source updates. These events can identify plausible explanations for a jump and suggest further checks. Timing alone does not prove causation.
For a website, a traffic change after a search update may also coincide with seasonality, a new page mix or a broken tracking configuration. For a store, an inventory jump may reflect a reporting-state change rather than new stock. Inspect the documentation before making a commercial decision.
Keep the timeline factual: what changed, when it was deployed and what was observed afterward. Separate the team's explanation from the event itself. That makes later review possible even if the preferred explanation changes.
Do not use an annotation as an accusation against a provider. A suspected measurement change should remain suspected until supported. The purpose is to improve interpretation, not replace one confident unsupported story with another.
Build simple regression checks around the pipeline
Test known cases for the query or importer. A map query should include known examples of relevant element types and boundaries. A reporting importer should preserve dates, units, blanks and duplicates according to documented rules.
Check totals after each transformation. A join that unexpectedly removes half the rows or a category mapping that begins with a new release deserves attention before the final chart is published. Save enough intermediate counts to locate the change.
Use fixtures that would fail for the actual discovered bug, not tests that merely repeat the implementation's assumptions. A point-only query test built entirely from point examples would not protect against missing ways or relations.
The same principle applies to a calculation tool. Include zero, missing, inconsistent and large inputs, then verify the expected mathematical behavior independently. A smooth interface should not disguise a fragile measurement pipeline.
Publish the path when it affects the decision
An endpoint summary can be useful when accompanied by the full available series and its definitions. Let readers inspect the values behind a claim such as doubled or declined. Include the source periods, method breaks and unresolved gaps.
If only two values exist, say so. You can still calculate their difference accurately. What you cannot establish is whether the movement was steady, when it occurred or whether the same definition applied throughout without additional evidence.
For a business test, the Test Planner can record a baseline, version changes and the observations needed for the next decision. It does not reconstruct missing history from a headline or turn a before-and-after difference into a controlled experiment.
The practical rule is to inspect the path and the measurement process before choosing a story. Two dates are a useful beginning. They are rarely a complete explanation of what changed.
Ask for the missing observation explicitly
When a supplier or report provides only a start and end value, ask whether the intermediate series is available and whether the method changed. Ask for definitions as well as numbers. A downloadable sequence with no stable unit can still be unsuitable for the intended comparison.
If the source cannot provide more detail, keep that limit in the final note. Do not describe the absence as proof of concealment or misconduct. The data may simply not have been collected at the required frequency.
Then decide whether the remaining evidence is enough for the decision. A rough sensitivity exercise may tolerate missing history; a claim about a sustained market trend may not. The right standard follows from the consequence and specificity of the claim.