A market headline can be correct and still be the wrong reason to change your prices. The newest official UK online sales release shows why: the total fell, several store types rose, and the answer changed with the date range.
Open the free retail market explorer to compare the two time windows. The source was published on 23 October 2026 and covers September 2026. It is a dated snapshot, not a live feed of individual orders.
A one-month rise can sit inside a three-month fall
We downloaded the category chart from the ONS September retail bulletin and checked its signs. Two of its six store-type rows show a positive monthly change alongside a negative three-month change:
| Online spending value | September vs August | July–September vs April–June |
|---|---|---|
| Department stores | +0.6% | −1.8% |
| Textile, clothing and footwear stores | +0.6% | −4.9% |
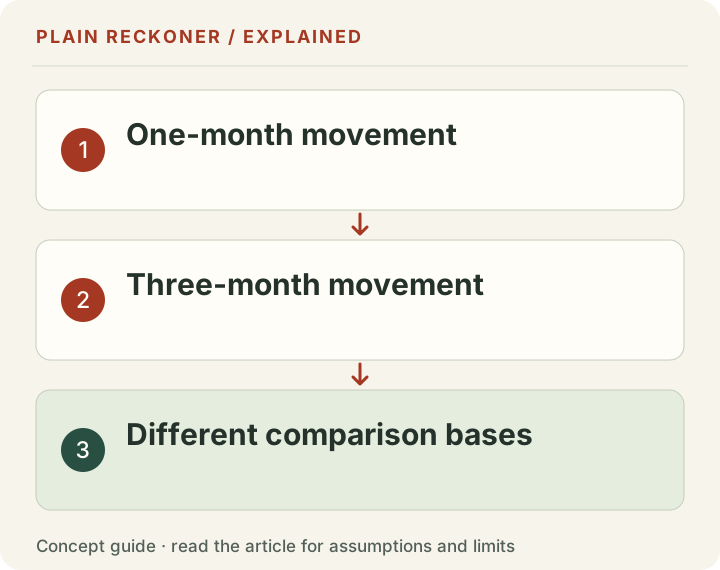
These are seasonally adjusted spending-value changes in Great Britain. The monthly comparison uses two months; the three-month comparison uses two three-month windows. They are not two versions of the same calculation.
A single rebound does not erase a weaker quarter. A weaker quarter also does not prove the latest month fell. Both statements can be true.
More rising rows does not mean a rising total
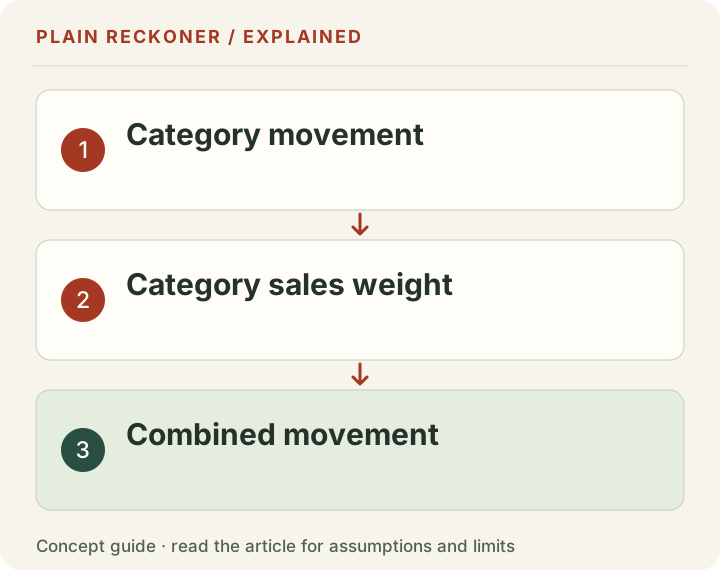
Five of the six listed store-type rows have positive monthly changes, while the overall online-spending figure is negative. That is not an error to “fix” by averaging the percentages.
The groups do not carry equal spending weights. A large group can move the total more than several small groups. An average of six growth rates answers a different question from growth in the combined spending value.
The published data and method keep the aggregate separate from the category rows. The normalized history also contains subgroup totals: adding every row would count some activity twice.
Recent data still needs a date label
There are at least three dates to keep apart:
- Observation period: when the spending happened.
- Publication date: when the source released its estimates.
- Review date: when we checked and processed the source.
Opening a report today does not turn its older observations into today's purchases. This release also revises earlier estimates, so an older screenshot can differ from the current workbook without either being fabricated.
Our monthly-series download retains the official series code, period, unit, adjustment basis and source cell. The script excludes revision tables from the observation count and rejects conflicting duplicates. Blank observations remain missing, rather than becoming zero.
Do not mix countries, months or types of sales
The Statistics Canada release published on 23 October reports a 1.1% monthly rise in seasonally adjusted retail ecommerce value for August. That is a different country and month from the UK September comparison. Its early September total-retail indicator is not a September ecommerce figure.
The US Census September release covers total retail and food-service sales. It is not an ecommerce-only monthly total. Do not use it as one just because it is newer than a quarterly ecommerce report.
Spending value is also different from purchase volume. Customers can spend more because prices rose, buy more units, or change what they buy. A revenue change alone does not identify which happened.
What this means for a small store
Use market data as context, then check your own matched figures. A national fall does not show that your product is overpriced. A national rise does not promise more orders for your store.
Before discounting, look at your product’s available stock, completed sales, in-stock days, price and costs. Check whether traffic, availability, product mix, advertising or returns changed. Do not treat every slowdown as a pricing problem.
If you choose to test a sale, calculate its recovery target first. A product selling for $40 with a $24 cost leaves $16 before other costs. A 20% discount leaves $8. Matching the original contribution needs twice as many units, before campaign spending. That is arithmetic, not a forecast of extra demand.
The inventory markdown test includes selling fees, campaign cost and a finite-stock check. The worked discount guide explains the calculation. Keep your store numbers separate from the public market snapshot.
A useful next check
Pick one product and one question. Compare matched dates, write down the metric definition and record what you changed. If you run a promotion, measure units and contribution after the entered costs, not only sales value.
Use the market explorer to check the broader period. Use your own reports to decide whether that context fits your store. If the two do not line up, request a free manual review and tell us which comparison you are trying to make.
The headline and the online series answer different questions
A national retail release can contain total sales, online sales, spending values and inflation-adjusted volumes in the same document. Those are useful views, but they are not interchangeable. Select the series before interpreting the headline.
ONS's methodology guide describes a sample-based survey covering Great Britain, with a separate question for online turnover. It does not cover Northern Ireland in this series. The geographic label matters when comparing it with a claim about the entire UK or with another country's report.
A store selling across borders may have a very different customer mix from the national series. An English-language website does not necessarily have a mainly British audience. Use the actual destination or customer geography in your records before deciding the national result is your relevant comparison.
This is not a reason to discard official data. It is a reason to use it for the question it was designed to answer and keep your own business question separate.
A weighted-total example you can reproduce
Counting rising categories is not enough to determine the direction of total spending. Consider a separate chosen example with two categories, unrelated to the exact ONS weights.
Category A begins at $900 and falls ten percent, ending at $810. Category B begins at $100 and rises twenty percent, ending at $120. One category falls and one rises. The simple average of their growth rates is positive five percent.
But combined spending falls from $1,000 to $930, a seven-percent decline. Category A's $90 fall outweighs category B's $20 rise. The combined change depends on the starting amounts, not an equal vote per category.
The same logic applies when five small rows rise and a larger row falls. To reproduce an aggregate, you need the appropriate levels, weights and scope. Do not invent equal weights because the table gives every row the same visual width.
Also check whether rows overlap. A parent category and its child categories cannot all be added as independent activity. An aggregate total belongs beside its components as a comparison, not inside another sum of those same components.
One-month and three-month movements can disagree without error
A one-month change compares the latest month with the month immediately before it. A three-month-on-three-month change compares two blocks. A rebound in the latest month can leave the latest three-month average below the previous block.
Use a chosen index example. April, May and June are each 100, so that three-month average is 100. July is 90, August is 90 and September is 91. September rises about 1.11% from August, but the July–September average is about 90.33, roughly 9.67% below the earlier block.
Those two results answer different questions about the same six observations. Neither is a correction of the other. A headline choosing only the monthly rebound can omit the weaker broader period; a headline choosing only the quarter can hide the latest improvement.
This does not mean a three-month window is always the correct decision horizon. A short-lived stock issue may matter this week. A supplier commitment may depend on months of demand. Choose the period for the operating decision and retain the other view as context.
Spending value is not units sold
A store's revenue can rise because it sold more units, charged higher prices or sold a different mix. It can fall while unit sales rise if the mix shifts toward cheaper items or discounts deepen. A spending-value index alone cannot distinguish those mechanisms for your product.
For a chosen example, one hundred units at $20 produce $2,000. One hundred twenty units at $15 produce $1,800. Unit sales rise twenty percent while revenue falls ten percent. Costs and contribution need another calculation.
Before responding to a market-value decline with a discount, inspect your own units, realized prices and product mix. If units are stable but a promotion reduced price, more discounting may intensify the problem. If stockouts reduced units, changing the price does not create unavailable stock.
Keep inflation-adjusted national volume and your own physical unit count distinct as well. A statistical volume series across varied goods is not the same thing as counting the items in your order export.
Revisions are part of the evidence record
Official estimates can be revised as information and methods are updated. Preserve the publication version used in a decision. Record the source file, release date, observation period and relevant series code.
When a later release differs, compare the revised history rather than mix an old denominator with a new numerator. A calculated growth rate can change simply because the earlier value was revised. That does not automatically mean your spreadsheet is broken or that the agency fabricated the earlier estimate.
Our downloadable normalized series retains source references to help trace those changes. That provenance matters more than describing a large file as “all current market data.” A source can be recent while containing many historical observations, revisions or missing periods.
If you reuse the figures in a chart, keep the release date and geographic/adjustment basis visible. Do not relabel the same September observations as October sales because the chart was exported in October.
Compare a small store with context, not with a verdict
Start with the store's own matched periods. Check sales after the relevant discounts and reversals, units, order count, traffic, product availability and contribution. State the currency and treatment of customer shipping and tax.
Then ask what the market data adds. It may suggest a broader slowdown worth investigating or show that your category differs from the total. It does not tell you what your price should be, whether your campaign worked or whether your product is obsolete.
A small store can diverge sharply from a national total because a few orders matter more to its result. A local campaign, a wholesale buyer or a stockout can dominate the month. Keep absolute counts beside percentages so a change from two orders to four is not mistaken for evidence of a broad trend.
Likewise, a store can grow in a declining category. That observation does not prove it gained national market share unless the scopes and denominators support that claim. Describe the store's actual result and the official context separately.
Use the context to choose a limited test
Suppose your own records show slower sell-through, stable traffic and enough available stock. That may justify reviewing the offer, but it still does not establish that a discount will help. Calculate how much contribution the proposed price gives up and the extra units needed to recover it.
Compare that target with sellable stock and a realistic test budget. Include selling fees, fulfillment, promotion cost and the expected treatment of returns. Do not borrow a national category growth rate as the demand lift caused by your discount.
Keep the test focused enough to interpret. Record the price, dates, placement, audience, stock and major concurrent changes. A before-and-after result may still be affected by seasonality or other factors. Report those limits rather than turn a national headline and a store promotion into a causal story.
Afterward, compare completed-order contribution as well as revenue. A busier shop can leave less money if the price reduction and cost mix outweigh the extra sales. The market explorer supplies context; the store's own cost and order records decide whether the offer met its purpose.
Keep country comparisons honest
For each country's release, write the observation month, publication date, currency, coverage, adjustment and whether the measure is value or volume. Do not compare a preliminary all-retail indicator with a finalized ecommerce-only series as though they measured the same thing.
A synchronized date on two news articles does not mean the underlying data covers the same month. Different agencies have different schedules. A report may include an early estimate for one series and a complete estimate for another.
Those details can feel less exciting than a claim that online retail is booming or collapsing everywhere. They are what make the comparison useful. A clear, dated scope helps you decide which public signal deserves attention without pretending it can replace your own business evidence.
Before sharing a comparison, ask someone to read only its title, chart labels and source note. They should be able to identify the country, month, measure and comparison window without guessing. If those details are missing, the chart can communicate a stronger or different claim than the underlying analysis.
Keep the raw source version under the project record and the reader-facing explanation concise. That lets a curious reader inspect the work while a store owner can quickly see whether the observation is relevant. Clear scope is part of the value, not an obstacle to an interesting headline.