
A query-feature percentage belongs to a defined sample and date. It is not automatically the chance that a reader sees that feature on Google today.
Ahrefs’ original study describes 146,122,391 desktop search-result observations from September 2025. Its reported AI Overview rates include 0.9% for navigational queries, 2.1% for transactional queries, 4.3% for commercial queries and 57.9% for question queries. Its overall sample rate was 20.5%.
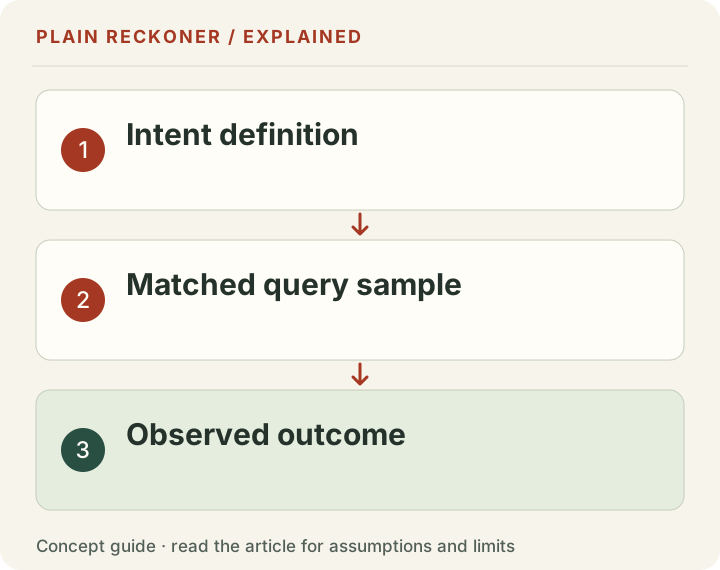
Preserve what each category counts
| Vendor category | Historical AI Overview rate |
|---|---|
| Navigational | 0.9% |
| Transactional | 2.1% |
| Commercial | 4.3% |
| Branded | 13.1% |
| Non-branded | 24.9% |
| Question | 57.9% |
These categories are not necessarily disjoint. The vendor assigns intent and query-type labels, and a keyword database is not the same population as every search performed by real people. The table also does not establish a mobile rate, a country-specific rate or the current result for a particular phrase.
Our previous headline used the present tense without enough emphasis on those limits. The October revision makes the historical desktop scope explicit.
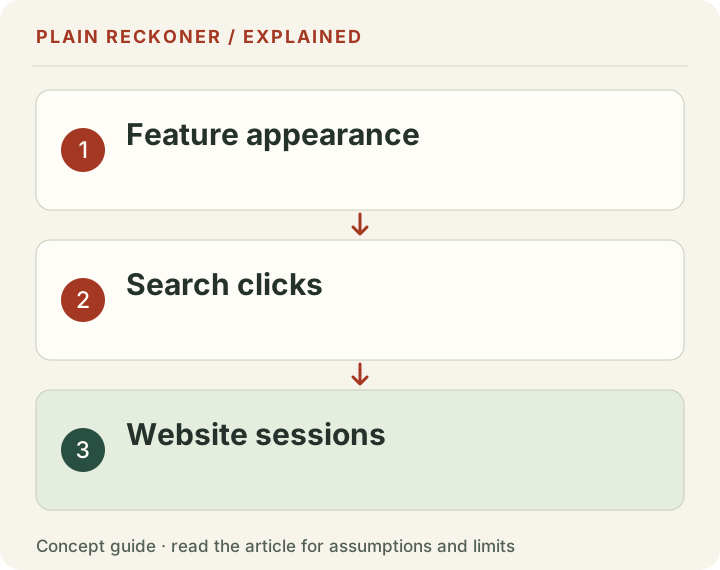
Feature appearance and clicks are different measurements
An AI Overview appearing does not tell us whether a particular publisher would otherwise have received a click. That would require a click outcome, a relevant comparison and attention to the queries and users involved.
A study of browsing behavior and a study of a vendor’s keyword database can answer different questions. Similar percentages do not make them direct replications, and their different sample sizes cannot be compared as if every observation had the same definition.
The earlier article also mixed separate studies of comparison, review and buying queries with this broad intent table. Those labels and populations were not matched. We have removed the combined conclusion that a particular content format faces one universal 81–95% rate.
Use external research to choose questions, then check the actual result
External studies can identify a pattern worth investigating: intent and question form may be associated with feature appearance. For a publishing decision, inspect current results for the specific questions you can answer and record the date, locale and result types.
Look for a useful contribution beyond a generic summary: a reproducible calculation, inspectable data, a source correction or a tool that helps a reader use their own figures. None guarantees traffic, but each can provide a concrete reason to visit a source page.
Do not rewrite everything into navigational keywords because their historical rate is low. A new publisher cannot manufacture established brand demand by changing a title, and a low feature rate says nothing by itself about competition or reader value.
Our two-endpoint note explains a related problem: two observations cannot reveal the path between them. The requirements comparison applies the same care to units and source dates in publisher monetization.
Correction, 19 October 2026: sample date, device scope and category definitions are now explicit; mixed-study and present-day universal claims have been removed. Evidence grade: C: a bounded reading of a vendor’s historical study, not our own live search census.
Read the percentage in the right direction
A rate within a category answers a different question from a category's share of all AI Overviews. If many observed AI Overviews belong to informational searches, that does not mean nearly every informational search has an AI Overview. The denominator changes between those statements.
Use a chosen example to see the difference. Suppose a study contains 1,000 question queries and 400 of them show a feature. The feature rate within question queries is 40%. If the whole study has 2,000 feature appearances, those 400 account for 20% of appearances. Neither percentage replaces the other.
A reader deciding which page to improve needs the first kind of rate only as background. Even that category rate does not reveal the result for the reader's particular query. A large sample can estimate a well-defined sample quantity precisely while remaining a poor match for a different country, device or date.
Keep the unit visible when sharing the finding. Say historical keyword-sample feature rate, rather than percentage of users who lost a click. The second statement requires behavior data and a comparison that this table does not supply.
Separate overlapping categories before combining anything
Question form, brand presence and commercial intent describe different properties. A person can ask a branded commercial question. Adding the percentages in this table would count overlapping groups and would not produce an overall exposure rate.
The same problem arises when weighting a website's content. One article can target several queries, and one query can lead to several pages. Counting article titles with a question mark does not measure the share of Search impressions exposed to an AI feature.
If a publisher wants a content inventory, tag each page for its primary reader task and preserve secondary tags separately. If the publisher wants a query analysis, use query observations as the unit instead. Do not mix page counts and query impressions in the same percentage without a documented relationship.
This is why a public homepage scan should avoid claiming an AI traffic-risk score from its links alone. A visible question in navigation is an observation about wording. Actual search demand, result appearance and user behavior require different evidence.
Start a small current query review you can reproduce
Choose a manageable set of queries that already matter to the business. Use actual Search Console evidence where available, along with questions customers ask. Include different reader tasks instead of selecting only phrases expected to confirm an alarming conclusion.
For each check, record the exact phrase, date, country or location context, language, device and visible result features. Keep the checking method consistent. Manual searches and an external provider's result dataset can differ, so note the method rather than treating all observations as identical.
Record whether the website appears in conventional results, whether a relevant AI feature appears and whether the website is cited there. These are separate fields. Absence from one check does not prove permanent absence, and a citation does not prove a visit.
Repeat checks when the decision requires a trend, while staying within the relevant service's permitted use. Keep the full sequence instead of replacing earlier observations with the latest result. A record of change is more useful than a screenshot that happens to support the desired story.
Connect visibility to visits without claiming causation
Google's Search Console metric guide defines impressions, clicks, click-through rate and position. These measure different stages of search presentation and interaction. They should not be converted into revenue through an unexplained multiplier.
Consider chosen figures for a publisher: 10,000 eligible impressions, 200 clicks and 150 measured site sessions over a period. CTR is 2% using the reported clicks and impressions. The session count can differ from the click count because the systems and definitions differ; it is not automatically evidence that 50 visits were lost to AI.
Now suppose clicks fall to 160 while impressions remain 10,000. CTR becomes 1.6%. That establishes a change in the recorded ratio. It does not establish which feature caused the change. Position, query mix, competitors, titles, device mix, demand and the surrounding result page can all deserve investigation.
Break the report into comparable groups before drawing a conclusion. Compare the same page and query scope, then inspect country and device. A site-wide average can move because the mix changed even when the rate for an important individual query did not.
Distinguish a traffic scenario from a forecast
A publisher can ask what would happen if search sessions fell by a chosen percentage. That is a useful stress test if its assumptions remain visible. It is not a prediction derived from the Ahrefs table.
Suppose a site earns $1,000 per month, and 60% of that revenue is associated with search visits under its current records. If that portion falls 20% while all other revenue stays unchanged, the chosen scenario loses $120 and leaves $880. The calculation is $1,000 × 60% × 20%.
That simple scenario assumes the affected visits retain the same earnings relationship and that other channels do not change. It does not model a change in audience mix, ad rates, conversions or replacement visits. Write those assumptions beside the result.
A category's historical feature rate is not the loss percentage to insert into this scenario. Use several chosen cases to understand sensitivity, then gather business evidence to judge which cases deserve attention. Stress testing is valuable precisely because it separates a decision boundary from an unsupported forecast.
Improve the reason to visit, rather than chasing a supposedly safe label
An article that restates a widely available definition gives a reader less reason to leave a result summary. But changing the title into a buying phrase does not by itself create a better page or a lower-risk business.
Start with a job the reader cannot complete from a short general answer. Let the reader enter real figures, inspect a documented comparison, check an exact rule or download a clearly defined table. Explain the assumptions and show a worked example so the visitor knows how to use the result.
For an ad-revenue page, that might mean distinguishing session RPM from page RPM and checking whether the denominator changed. For a store page, it might mean separating revenue from contribution after payment fees and returns. The value comes from helping with the actual task, rather than simply including more keywords.
Google's AI-features guidance says the established SEO fundamentals remain relevant and that there are no additional special optimizations required for inclusion. That is not a guarantee of visibility. It is a reason to prioritize a useful, crawlable page over a claimed secret AI-ranking technique.
Choose controls for the use you intend to allow
A publisher considering AI controls should identify the particular use first. Search participation, preview display and model-related content uses are different questions. A control for one purpose should not be advertised as a universal off switch.
Google's content-control overview explains the available mechanisms. Read the current provider documentation before changing settings, and record the exact setting and date. If the project later compares results, that change becomes part of the timeline to consider.
Do not claim an immediate effect from a single before-and-after screenshot. Crawling, report availability and the way a feature is presented can have their own timing. A useful change log records what the owner did and what was subsequently observed without assuming the first caused every later movement.
Our Google-Extended guide covers a related distinction. A training or grounding token is not interchangeable with Search-specific participation settings. Keep the provider and purpose attached to every recommendation.
Make a content decision with an explicit review point
For an existing page, write down the problem in measurable terms: relevant impressions but few clicks, visits that do not complete the tool, or outdated instructions that no longer match the source. Choose an improvement that addresses that problem rather than trying to solve every search risk at once.
Preserve a baseline with a meaningful period and enough context to interpret it. Record the publication change and avoid changing several unrelated variables if the goal is to learn what helped. Low-volume sites may need longer to distinguish an ordinary fluctuation from a useful signal.
Look beyond CTR alone. A title can attract more clicks while sending the wrong readers. Check whether visitors reach the intended tool, understand its limits and complete the task. A smaller number of well-matched visits can be more useful than an alarming headline that attracts curiosity without providing an answer.
Define what would change the decision. If the new introduction reduces confusion but impressions remain limited, the next action may be distribution or stronger coverage of a useful question. If visitors reach the tool but cannot use it, fix that workflow before publishing more articles with the same problem.
What this study can and cannot support
The historical study supports a bounded observation: feature appearance differed across the vendor's query categories in its September 2025 desktop sample. It is a useful prompt to ask more precise questions about a publisher's own search exposure.
It does not establish that questions are a bad content format, that branded traffic is universally safe or that a given percentage of advertising income will disappear. It also does not prove how Google's results look today for every country or user.
Use the table to understand the research question, then use current scoped observations and your own outcomes to decide what to do. Preserve the difference between appearance, citation, click, session and revenue. That sequence keeps an interesting external statistic from becoming an unsupported business forecast.
Keep a source note other people can inspect
When sharing a chart from this article, retain the dataset date, desktop scope and category warning in the same view. A cropped percentage can travel much farther than its explanation, especially when reused in a presentation or social post. Labeling it properly protects the reader who never opens the longer study.
Keep the original study link rather than citing a summary that repeats its headline. If a later study uses different definitions, present it separately until the measures can be reconciled. A newer date alone does not make two series comparable.
Finally, distinguish the date a source was checked from the period it measured. Reading a 2025 dataset again in October 2026 does not turn it into an October 2026 measurement. That small distinction prevents a surprisingly large amount of misleading search advice.