
This full-return example assumes no customer-paid shipping. If you charge shipping or retain any shipping payment on a return, reconcile that separately before treating this as your full order result.
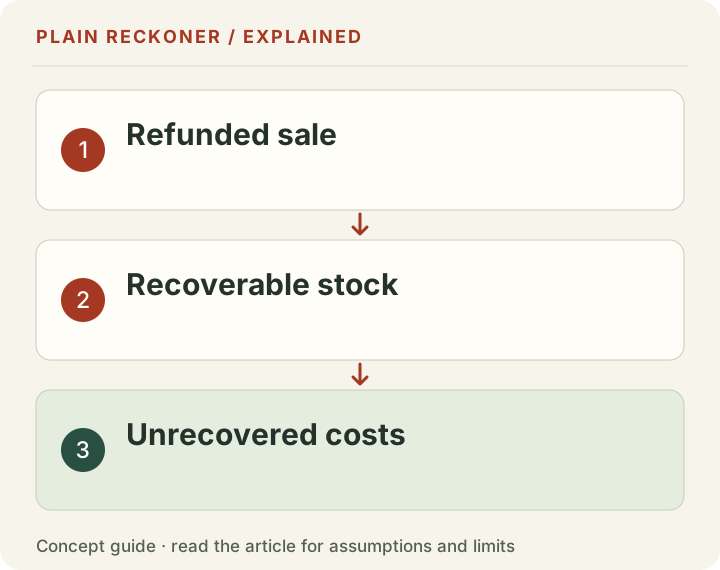
An order can disappear from revenue while its costs stay behind. Refund the customer and you may still have paid to acquire, process, pack and ship that order. Getting the item back does not automatically undo those costs.
The free ecommerce return cost calculator compares a kept order with a fully returned order. It then weights those two outcomes by the full-return rate you enter. It is a scenario, not a prediction of future returns.
Start with the kind of return you mean
A physical return, a refund, an order cancellation and a sales-report reversal are related but different events. A customer can receive a refund without sending an item back. An order edit can reduce recorded sales without any physical return.
Shopify's sales reporting documentation makes that distinction explicit. Its broader sales reversals should not silently be used as a physical-return rate.
Our scenario covers fully refunded product orders with one cost pattern. For mixed baskets, partial refunds, exchanges and multiple items, use a matched cohort with the actual refunded value and recovered product costs in the order contribution calculator.
Work out the kept-order result first
Use this worked example, not an industry benchmark:
| Input per original order | Example |
|---|---|
| Product selling price | $60 |
| Product cost | $24 |
| Outbound shipping and packing | $6 |
| Original percentage fee | 3% |
| Original fixed fee | $0.30 |
| Advertising cost | $10 |
The original selling fee is $2.10. A kept order leaves $60 − $24 − $6 − $2.10 − $10 = $17.90 of contribution after those costs.
This does not include tax, overhead, owner pay or other unentered costs. Calling it net profit would overstate what the calculation establishes.
Now calculate the fully returned outcome
Suppose the customer receives all $60 of product revenue back. You recover 80% of the original $24 product cost into usable stock, pay $5 return postage and spend another $2 handling the return. None of the original fee is refunded in this example.
The unrecovered product cost is $4.80. The returned order leaves:
−$4.80 unrecovered cost − $6 outbound cost − $2.10 original fee − $5 return postage − $2 handling − $10 advertising = −$29.90.
The difference between a kept and fully returned order is $17.90 − (−$29.90) = $47.80 of contribution. That is the contribution lost relative to the kept outcome, not an additional cash invoice for $47.80.
Why “the product is back in stock” is not enough
Recovering product cost changes the economic loss, but it is not a second sale. An item that originally cost $24 does not generate $24 cash merely by returning to the shelf.
Use a realistic recoverable cost value. Damage, missing packaging, inspection, refurbishment and resale restrictions can lower it. A recoverable item can also take time to sell again.
Keep that assumption separate from extra handling costs. Do not subtract the full product cost as a write-off and then subtract the same write-off again in the handling field.
Check which original fees remain
Stripe's refund-fee explanation describes retained original processing fees and notes that fee schedules affect refund treatment. Other processors and negotiated contracts can differ.
The tool lets you enter the percentage of original fees refunded to you. Zero and 100% are different assumptions, not moral judgments about a provider. Use the schedule and settlement records that apply to your account.
A provider's public headline rate is also not always your effective cost. Cross-border, currency, marketplace and other fees can matter. The model uses your entered costs instead of guessing those charges.
How a return rate changes the scenario
At a 10% full-return rate in the example, the weighted contribution per original order is:
90% × $17.90 + 10% × (−$29.90) = $13.12.
For 100 original orders with the same assumptions, that is $1,312. It is not a measurement of 100 real orders or a promise that your next cohort behaves that way.
The cost break-even rate is $17.90 ÷ $47.80, about 37.4477%. The tool reports a conservative two-decimal threshold of 37.44%. This is where the entered cost scenario reaches zero contribution; it is not a target return rate to aim for.
Match refunds to their original orders
Returns processed this month may belong to orders acquired last month. A sudden increase in refunds can reflect timing, product mix or a reporting change, rather than a sudden change in customer behavior.
Use cohorts old enough for their return window to develop. Keep product, country and fulfillment differences visible instead of averaging incompatible orders together. Compare both the rate and the costs per return.
Shopify's return management guidance can help you understand the platform workflow. A workflow guide does not replace the financial reconciliation above.
Test the costs you can actually change
Try the return cost scenarios with your own retained fees, recovery rate and return postage. Then examine whether the biggest cost comes from acquisition, fulfillment, recovery or handling.
If you are considering a promotion, connect this check with the free shipping threshold and inventory markdown test. More orders are useful only when you understand what each outcome leaves. For a more detailed cohort question, ask for a free manual review.
Use the outcome gap to understand a rate change
The example's kept-to-returned contribution gap is $47.80. Each percentage point added to the full-return share reduces weighted contribution per original order by one percent of that gap, or $0.478, while all other assumptions remain fixed.
| Full-return share | Weighted contribution per original order | Contribution across 100 matching original orders |
|---|---|---|
| 0% | $17.90 | $1,790 |
| 10% | $13.12 | $1,312 |
| 20% | $8.34 | $834 |
| 30% | $3.56 | $356 |
| 40% | −$1.22 | −$122 |
These are deterministic scenarios. The table does not estimate how many returns your next hundred orders will generate. The real distribution can vary with product, season, size, destination, customer mix and the maturity of the cohort.
It is useful for a decision because it shows the consequence of a stated change. If a proposed promotion changes the kinds of orders you acquire, do not assume the old return share or recovery value remains unchanged. Test the new cost pattern explicitly.
Improving recovery helps, but does not undo every cost
Keep the original costs and full refund, but change the recoverable share of the $24 product cost from 80% to 100%. Recovery increases by $4.80. The returned-order outcome improves from negative $29.90 to negative $25.10.
At a ten-percent full-return share, weighted contribution becomes 90% × $17.90 plus 10% × negative $25.10, or $13.60 per original order. Across the chosen hundred orders, that is $1,360, $48 more than the original scenario.
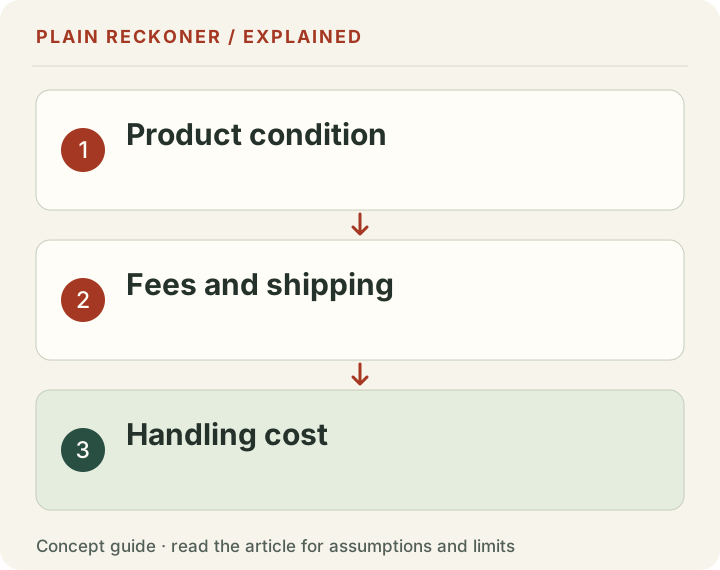
The improvement is real within the model, but even perfect stock-cost recovery does not erase outbound delivery, advertising, retained fees or the entered return handling. A returned item can be fully reusable while the original order still loses money.
Keep extra recovery work in the model too. If improving recovery requires paid inspection, replacement packaging or refurbishment, add the incremental cost. Do not count the recovered stock value as cash from a new sale and then ignore the cost of making it saleable.
A partial refund needs a different calculation
Suppose a customer keeps the product but receives $10 back for a documented issue. That is not the same outcome as returning the entire $60 product and recovering inventory. The remaining revenue, product cost, original fee and any handling costs belong in a matched order calculation.
If the customer returns one item from a multi-item order, record the refunded value and cost of that item, not an arbitrary percentage of the whole basket. Shipping and fees may not reverse in the same proportion. A replacement can create a new outbound cost without producing new customer revenue.
The simple full-return calculator intentionally does not infer those details. Use the cohort contribution tool or a manual order reconciliation when the outcomes are mixed. A narrower model with a visible boundary is safer than a broad “return cost” score that guesses the missing amounts.
Shopify's refunding-order guidance separates refunds, restocking and return workflows. It also distinguishes processing fees from other transaction fees. Use the rules and actual statements for your account rather than assume every fee is refunded when the customer receives money back.
Count the right denominator for your return rate
An order-return rate, an item-return rate and a refunded-value share can all be useful. They are not interchangeable.
Take a chosen cohort of 100 orders containing 200 items. Ten orders each return one item, and the returned items represent $300 from $10,000 original product sales. The share of orders with a return is 10%. The item-return share is 5%. The refunded-value share is 3%, assuming those are the matching product refunds.
None of those figures is automatically the full-order-return share used in the opening model. A returned item from a larger basket is not a fully refunded order. Entering the 10% affected-order rate into a full-return model could overstate or otherwise distort the cost pattern.
Name the unit in your report and keep it beside the percentage. Where the dataset mixes full and partial returns, separate them or calculate actual matched contribution directly. Do not force a mixed history into one binary assumption without explaining the approximation.
Give the cohort time to develop
Orders placed yesterday have had little time to return. Orders placed six weeks ago have had more. Comparing their return shares without a common observation age can create an apparent improvement that is only incomplete follow-up.
Choose a cohort definition and a review cutoff. For example, group orders by purchase period and review each after the relevant return opportunity and processing delay. The exact timing depends on your disclosed policy and actual operations; this guide does not prescribe a universal window.
Keep late events visible. A delayed parcel, slow inspection or refund posted after the cutoff can change the result. A preliminary review can be useful if it is labeled preliminary and later updated. It should not become a permanent claim that the new product has a lower return cost.
Seasonal comparisons need the same care. A holiday cohort can have a different gift mix and return timing from an ordinary month. Record those differences before deciding a policy or product change caused the observed rate.
Find preventable costs without blaming customers
A cost review should help identify operating problems, not presume that every return is abusive. Product descriptions, measurements, compatibility information, packaging, fulfillment accuracy and product condition can all affect the experience. Use recorded reasons and inspect the supporting evidence.
Separate the customer's stated reason from a confirmed cause. A reason code is useful for triage, but it may not establish exactly what failed. Look for repeated patterns by product and batch, and compare with inspection findings where those are recorded.
Choose an intervention tied to the pattern. A size-related issue might need clearer measurements. Transit damage might need packaging work. Wrong-item incidents might need a picking check. Each action has its own cost and should be reviewed against later comparable orders.
Do not claim that changing the policy will improve profit without considering demand, customer trust and applicable obligations. This is an operating-cost model, not legal advice about what you may refuse to refund. Keep customer-facing terms clear and seek qualified advice when the rules are uncertain.
Preserve the evidence, protect the customer
For analysis, aggregated cohorts and product-level totals are often enough. You do not need to upload names, addresses, payment details or private tokens into a public calculator. Keep detailed operational records in the systems where they are appropriately controlled.
Save the source definition, cohort period, review cutoff, fee treatment and recovery basis with the result. Another person should be able to reproduce the contribution calculation without guessing which refunds belong to which sales.
Finally, review dollars as well as rates. A lower return share can coexist with a higher cost per return. A better recovery percentage can coexist with more handling expense. The useful conclusion is the contribution left from the matched original orders, with the costs and uncertainties visible.
Check the endpoints before trusting the average
At a zero-percent full-return share, the weighted result must equal the kept-order contribution. At a hundred-percent share, it must equal the returned-order result. A result that fails either endpoint is not consistent with this two-outcome model.
Recovery has limits as well. It cannot be negative or exceed the original product-cost basis in this model. A percentage of original fees refunded cannot be treated as a percentage of product revenue. The two percentages apply to different amounts and produce different dollar effects.
Check one change at a time. Increasing return postage by $1 lowers the fully returned outcome by $1. At a ten-percent full-return share, it lowers the weighted contribution by $0.10 per original order. Increasing advertising cost by $1 lowers both outcomes by $1 because acquisition occurred whether the order was kept or returned.
These checks are simple enough to reproduce by hand and useful for catching mislabeled inputs. They do not establish the accuracy of the source figures. A technically correct calculation still needs the actual fee, delivery and recovery records to describe a real cohort.
Keep those two validation tasks separate: does the model calculate the stated scenario correctly, and do the inputs accurately describe the completed orders? Both matter before acting on a cost recommendation.
An ecommerce return calculator needs more than a return rate
A refunded order can have outbound shipping, return shipping, processing, inspection and damaged-stock costs. Some of the product cost may be recovered when the item can be sold again. Keep that recovery separate from the refund rather than assuming either a total loss or a full recovery for every return.
For an arithmetic example, a returned item with a $20 recoverable product cost and $8 of additional return handling has different economics from an item that must be discarded. Both can produce the same refund amount and return rate. That is why ecommerce returns management should track the outcome of the returned stock as well as the request.
Use one original order cohort and allow enough time for its returns to arrive before comparing it with another cohort. The return-cost tool lets you explore explicit assumptions. It does not measure your store's actual return rate or the likelihood of reselling a returned product.