An extra payment option can bring an extra cost. Before adding buy now, pay later, ask what each completed order leaves after product costs, delivery, ads and the payment fee. Higher checkout revenue alone does not answer that question.
Stripe’s BNPL documentation explains the payment flow: customers pay over time while the merchant receives the purchase amount under the provider’s arrangements. That does not make the method free. Check the pricing for your country and payment method, plus your own agreement and settlement rules. The rates below are chosen examples, not quotes from a provider.
Start with one order
Take a $50 product order. Its product cost is $25, shipping and packing cost $5, and advertising cost $8. There is $12 left before the payment fee. Tax, refunds, overhead and owner pay are excluded from this simple comparison.
| Cost or result | Option A | Option B |
|---|---|---|
| Product revenue | $50.00 | $50.00 |
| Product, delivery and ad cost | $38.00 | $38.00 |
| Chosen payment fee | 3% + $0.30 | 6% + $0.30 |
| Payment fee on this order | $1.80 | $3.30 |
| Contribution after these costs | $10.20 | $8.70 |
The customer paid the same amount. The second payment option leaves $1.50 less on the order. For 100 otherwise identical orders, contribution falls from $1,020 to $870.
How many extra orders cover the difference?
Divide the contribution you want to preserve by the contribution per order under the alternative: $1,020 ÷ $8.70 = 117.24 orders. Since an order is a whole event, the store needs 118 orders in this example. That is 18 more completed orders than the original 100.
On a continuous-rate basis, $10.20 ÷ $8.70 − 1 is about 17.24%; a minimum threshold rounded up to two decimal places is 17.25%. Keep the whole-order target separate from that percentage. Neither calculation shows that offering BNPL will produce the extra orders.
Use the order profit calculator to compare your own costs. Enter sales of $5,000, 100 orders, product cost of $2,500 and ad spend of $800. Open other costs: set delivery to $500, fees to $180, refunds, recovered cost and return handling to zero. The result is $1,020. Compare it with $330 in fees to get $870. Check all the remaining assumptions before using either figure.
A new payment story: reach is not the same as profit
On 21 October 2026, Klarna announced Consumer FX for participating merchants. The company described shoppers paying in their own currency and reported early conversion and sales improvements. This is a current company announcement, not an independent experiment conducted by Plain Reckoner.
The news creates a useful business question: if a new payment option opens access to more buyers, how much does each additional completed order leave? The release does not answer that question for your product costs, delivery routes, return experience or payment agreement. A claim about sales cannot be substituted for contribution after costs.
Cross-border reach can change the cost picture as well as the number of buyers. An order may travel farther, take more support work or require a different return process. Do not assume those costs rise in every case, but do not assume they remain unchanged either. Compare the actual destinations and order mix before borrowing an uplift figure from a launch story.
That is how to use news without letting it make the decision for you. Record the dated announcement, identify the change it might create in your business, and test the cost consequence with your own figures. We have not connected to Klarna's private merchant data, reproduced its reported early results or estimated a profit increase from this announcement.
Separate genuinely new sales from payment-method switching
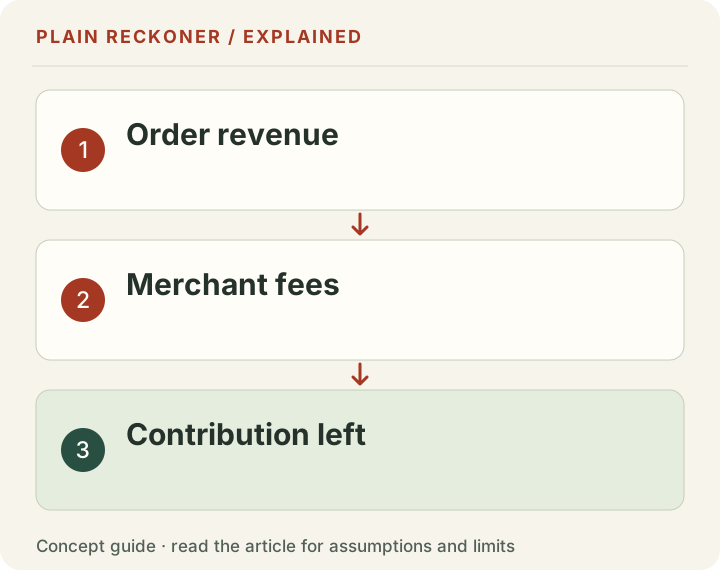
Imagine that the original 100 customers in our example still buy, but 40 choose the higher-fee option instead of the original method. The store now earns $612 from 60 original-method orders and $348 from 40 alternative-method orders. Total contribution is $960, or $60 below the original $1,020. There are no extra orders in this first scenario.
If the store then gains seven genuinely additional alternative-method orders at $8.70 contribution each, it adds $60.90. Contribution becomes $1,020.90, just above the starting point. That is a different hurdle from replacing all 100 original orders with the alternative method, which required 18 extra whole orders. The share of existing customers switching methods changes the calculation.
Do not use seven as a universal target. It follows from this exact choice of 40 switched orders, unchanged baskets and costs, no extra fixed expense and no returns. If more existing customers switch or each extra order costs more to acquire, the hurdle changes. Write down the switching assumption next to the result.
This distinction is often missing from a simple conversion comparison. A method can become popular among customers who would have paid anyway. Its share of orders shows usage, but usage alone does not establish additional demand. To assess the decision, separate adoption from the effect on all completed orders and contribution.
Derive the hurdle for your own store
Start with the contribution lost on orders that would have happened under the original method. Multiply the number of switched orders by the reduction in contribution per switched order. Add any extra fixed cost for the test, such as integration or a campaign. That gives you the amount genuinely additional orders need to cover.
Next, calculate contribution per additional order after the extra method's fee and all the matched variable costs. Divide the amount to recover by that positive contribution, and round the answer up to a whole order. If additional orders leave no positive contribution, adding more identical orders will not recover the fixed gap under that model.
For example, a $100 test cost on top of the $60 method-switching gap creates a $160 recovery target. At $8.70 per genuinely extra order, the continuous calculation is about 18.39, so the store needs 19 extra whole orders. Eighteen adds $156.60 and remains short; nineteen adds $165.30 and clears the modeled gap.
Treat this as a transparent planning calculation. It does not predict customers' behavior, the time needed to gain those orders or whether they would truly be additional. The useful output is a hurdle to compare with an observed result, not a forecast disguised as a precise number.
Test the whole basket when the order value changes
A higher average order value can help, but only if the additional revenue leaves enough after the additional costs. Suppose the alternative-method basket grows from $50 to $60. If product cost rises from $25 to $32 while shipping stays $5 and advertising stays $8, contribution before the payment fee is $15. At our chosen 6% plus $0.30 fee, the charge is $3.90, leaving $11.10.
That is more than the original $10.20 contribution, under these assumptions. But if the larger basket instead requires $35 of product cost and $7 of shipping, it leaves only $6.10 after the same ad cost and payment fee. The $60 headline sale is unchanged between those cases, while the business result is very different.
Check whether the larger basket contains full-price products, discounted bundles or products with different margins. Include heavier packaging, split shipments and any free-delivery promise. A single blended margin percentage can conceal those changes. If the product mix changes materially, calculate the important order types separately before combining the totals.
Do not apply one fee percentage to product revenue if the provider charges on a wider payment amount. Delivery receipts, tax collected or conversion charges may affect the actual statement. The small-order payment-fee guide explains how fixed charges and different fee bases change an effective rate.
Returns can reverse an attractive first result
A checkout test usually produces sales before all the return outcomes are known. If one group has more recent orders, comparing its refunds with an older group can make it look artificially better. Keep order dates, return dates and the return window clear. A recent cohort with few recorded returns may simply be incomplete.
The cash returned to the buyer is only one part of the cost. Original payment fees may remain, a returned item may lose some value, and delivery or handling can add another cost. Stripe's refunded-payment explanation describes retained original fees and agreement-dependent conditions. Check the specific payment method and your actual terms before entering a recovery rate.
Avoid assuming that returned stock is immediately as valuable as new stock. A product might be damaged, opened, seasonal or costly to inspect. Recovered product cost in the calculator is the value you choose to recognize from the return, not a new cash receipt. Keep the assumption visible so a reviewer can challenge it.
If two payment methods attract different baskets or buyers, compare the return outcomes for matched groups before attributing a difference to the method. We cannot tell from a payment button alone whether it changes returns. That requires observed outcomes and an appropriate comparison, not a generic percentage from another retailer.
Use the return-cost guide to keep a matched order cohort, recovered product cost and extra handling separate.
A simple test plan before adding the button
Write the primary question first: does offering the method improve total contribution for the eligible traffic under the costs we can observe? Choose a complete comparison window and record changes in promotions, product availability, delivery terms and traffic sources. Those changes can affect the outcome even when the payment method itself has no effect.
Where a properly implemented randomized test is feasible, compare eligible groups under the same conditions. Do not claim randomization if the platform merely compares different weeks or lets different shoppers self-select. A before-and-after review can still be useful, but its limits need to be clear. Our calculators do not turn it into a controlled experiment.
Track completed orders, charged amounts, actual fees, refunds and fulfillment costs. Keep failed or abandoned attempts separate from completed purchases. Decide how late returns will be incorporated and when you will review the result. A conversion increase measured before refunds is an earlier signal than a completed contribution comparison.
Also record whether an order used the new method, but do not mistake that label for proof the sale was caused by it. The counterfactual question is what would have happened without the option. A dashboard can report usage accurately while leaving that causal question unanswered.
Compare cash timing without confusing it with earnings
A payment arrangement can change when money becomes available, while the order's cost and contribution remain separate questions. Review settlement timing, reserves, deductions and any additional agreement conditions with the provider. Do not read a general description of merchants receiving payment as a promise that the cash reaches every bank account instantly.
For a practical cash check, place expected receipts and actual supplier, delivery and advertising payments on a dated schedule. Add the refund exposure you may need to fund. A profitable order can still create a short-term funding need if costs leave before money arrives. Conversely, receiving cash early does not make an unprofitable order healthy.
The cash-flow versus profit guide shows why these ledgers differ. Use it alongside the order contribution model, not as an alternative denominator for ROAS. Neither a payout total nor an approved checkout total alone establishes accounting profit.
If you cannot verify timing from the agreement, ask the provider rather than filling in a convenient assumption. Keep that uncertainty in the test notes. It is better to have an unresolved payment-timing question than a precise cash forecast built on an unsupported promise.
Read vendor uplift claims with four questions
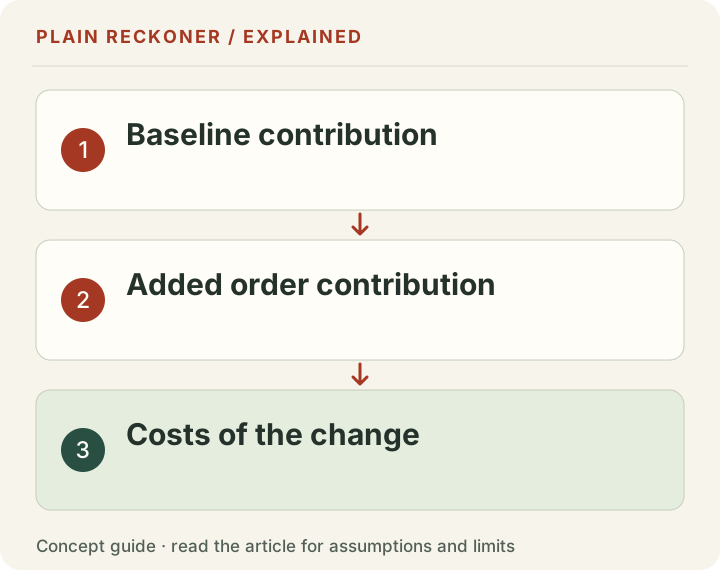
What outcome was measured: payment adoption, conversion, sales or contribution? Which merchants and buyers were included? What was the comparison group? Were fees, discounts, returns and delivery costs included? A short announcement may not supply all those answers. That makes it a lead for investigation rather than a complete decision model.
An average across merchants also may not fit your store. Product prices, audience, geography and existing payment options can differ. The relevant question is whether the claimed mechanism could apply to your customers and whether your own hurdle is low enough to test. Do not multiply a provider's percentage by your sales and label the answer expected profit.
Keep reported percentages in their original context. A relative increase in conversion differs from a percentage-point increase, and either differs from an increase in total orders if eligible traffic also changes. Ask for the denominator before comparing the figure with the whole-order target calculated earlier.
You do not need to dismiss a provider's claim to be careful with it. Give the source credit, name what it reports and preserve the unanswered questions. That produces a more useful business note than either repeating the headline as certainty or assuming every marketing claim is false.
Decide what would make you continue or stop
Set the recovery hurdle and the evidence you need before looking at the result. Include the effect on existing payments, genuinely additional orders and any fixed testing cost. Keep a lower-contribution case beside the main case so an optimistic product-mix assumption does not quietly drive the decision.
If results remain incomplete, extend the observation window or narrow the conclusion. You can say that checkout usage increased without claiming profit improved. You can calculate a fee gap without claiming the payment option caused a sales increase. Each statement should match the evidence actually available.
If you want our team to review the calculation, bring anonymized totals, the reporting window, the relevant fee terms and your specific decision. Keep customer records and account credentials out. The goal is a clear comparison that another person can reproduce, not a bigger file or a more impressive-looking dashboard.
The decision is yours: does the extra contribution from genuinely additional orders cover the additional cost and work? A provider’s average uplift claim cannot settle that for your store. Ask for the fee schedule, enter your figures and keep the result tied to those assumptions.